The State of Ecommerce Email in 2026: What the Data Actually Shows About Klaviyo Performance
Most Ecommerce Brands Think Their Email Program Is Working. The Data Disagrees.
There's a version of email marketing that looks fine on the surface. Campaigns go out on schedule. Open rates are acceptable. The revenue attribution dashboard shows email contributing something. The team is busy, the platform is active, and nobody is raising a red flag.
And then you look at the actual numbers — not the ones that feel good, but the ones that tell the truth — and the picture changes entirely.
We've been digging into data from a dataset of 500+ anonymized ecommerce Klaviyo accounts spanning categories including apparel, home goods, food and beverage, health and beauty, sporting goods, and jewelry. The accounts range from early-stage DTC brands to established retailers sending millions of emails per month. Every account was scored across five dimensions: email revenue performance, list size and growth, click rate, list health, and campaign targeting.
What the data shows should concern any ecommerce operator who relies on email to drive revenue. And most do.
Finding 1: 83% of Klaviyo Accounts Score D or Below
Let's start with the headline number, because it sets the context for everything else.
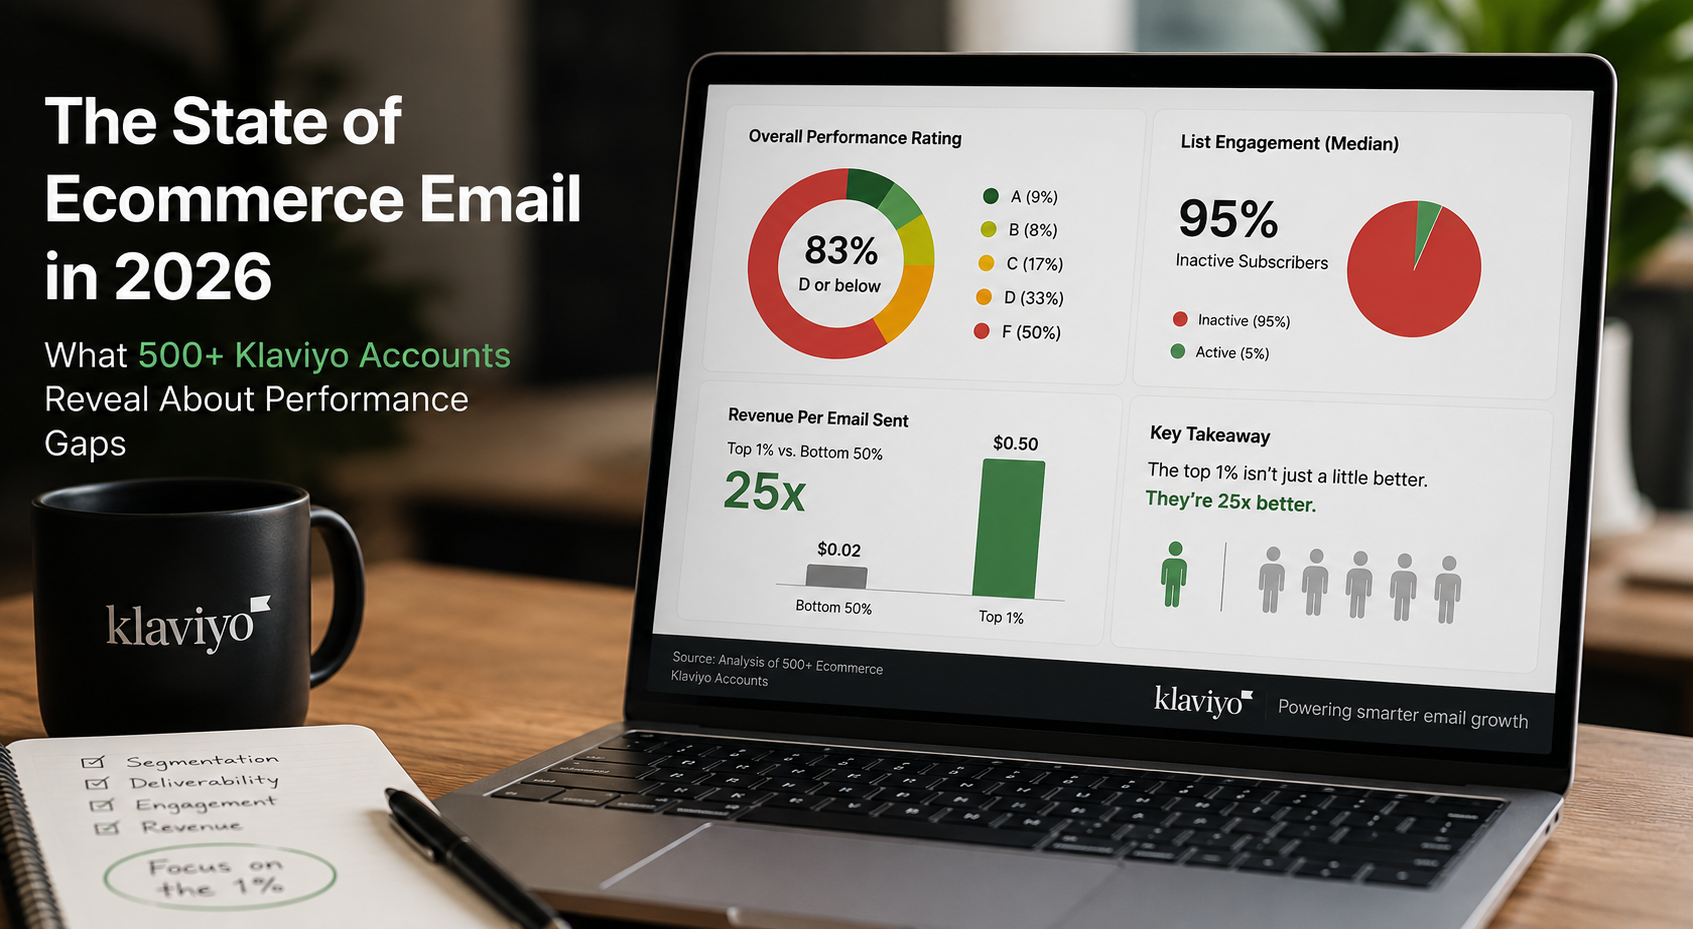
Of the accounts analyzed, 82.6% scored D or below on an overall account grade benchmarked against peers in the same category and revenue tier. Just roughly 1% of the dataset earned an A or B grade. The most common grade in the entire dataset was D-, earned by 25.9% of all accounts. The second most common was F-, earned by 16.4%.
This is not a story about a handful of struggling startups dragging down the numbers. The distribution holds across revenue tiers and product categories. Mediocre email performance is the norm in ecommerce right now — not the exception.
The question worth sitting with is: what tier is your program in? Because most brands assume they're performing better than they are, and the data suggests that assumption is usually wrong.
Finding 2: The Median Klaviyo List Is 95% Inactive
This is the finding that tends to stop people mid-sentence when they first hear it.
The median ecommerce Klaviyo account has nearly 95% of its email list classified as non-active. Two thirds of all brands in the dataset — 67% — have a list that is more than 90% dormant. The median active rate in the last 30 days across all accounts is just 1.7%.
Read that again: the average brand in this dataset has fewer than 2 in 100 subscribers who engaged with an email in the last month.
This creates two compounding problems. The first is financial. Klaviyo bills on a per-contact basis, not on engagement or revenue generated. If a brand has 200,000 contacts but only 10,000 are genuinely active, they are paying for 190,000 contacts that generate no revenue — every single month. That bill grows over time as lists accumulate more cold subscribers.
The second problem is strategic. Sending to disengaged contacts doesn't just waste money — it actively damages sender reputation. Inbox providers like Gmail and Outlook track engagement signals at the domain level. Consistent sends to contacts who never open, click, or convert train those providers to deprioritize your emails for everyone — including the subscribers who do want to hear from you. List health isn't an optional cleanup task. It's the foundation that determines whether your emails reach inboxes at all.
Finding 3: Email Is Generating Less Than Half of What It Should
The median brand in this dataset attributes just 15.3% of its total revenue to email. Industry benchmarks from Klaviyo and Litmus consistently place best-in-class email programs at 30% or more of total revenue.
By that standard, the average ecommerce brand in this dataset is generating roughly half the email revenue it should be — from a channel it's already paying to maintain, already staffing, and already spending time on.
42% of accounts generate less than 10% of their revenue from email. A channel they are actively investing in is contributing less than one dollar in ten. Meanwhile, the top quartile of performers in the dataset demonstrates that the ceiling is far higher: 25% of accounts exceed the 30% benchmark. The gap between the median and the top performers isn't a function of luck or list size. It's a function of how the program is built and run.
Finding 4: There Is a 25x Gap in Revenue Per Email Sent
Revenue per email sent — RPE — is arguably the most honest metric in email marketing. It strips away list size advantages, send frequency differences, and attribution window games, and shows you simply how much revenue each individual email is generating.
The numbers in this dataset are stark.
The median RPE across all accounts is $0.06 — six cents per email sent. The top 10% of accounts achieve a median RPE of $1.49. The bottom 10% earn essentially zero.
That is a 25-times difference in email efficiency between the best and the rest. To put it in practical terms: if a brand sends 500,000 emails per month at the median RPE of $0.06, they're generating $30,000 in monthly email revenue. A brand sending the same volume at the top 10% RPE of $1.49 generates $745,000. Same list size. Same send volume. Twenty-five times the outcome.
The RPE distribution breaks down like this: 44% of accounts earn less than one cent per email sent. A further 15% earn between one and five cents. That means nearly 6 in 10 brands are generating under a nickel per email. Just 7% of accounts exceed $1.00 RPE.
This is not a long tail of slightly underperforming brands. It is a structural split between a small group extracting serious value from email and a large majority that is effectively running their email channel at a loss.
Finding 5: Click Rate Predicts Revenue Per Contact by 4.4x
Click rate is not a vanity metric. In this dataset, it is the strongest available leading indicator of revenue per contact.
Brands in the top quartile for 30-day click rate — those above approximately 4.5% — earn a median of $0.44 per contact per month. Brands in the bottom quartile earn just $0.10 per contact. That is a 4.4x revenue-per-contact advantage for brands that have cracked engagement.
The median 30-day click rate across all accounts is 2.85%. Nearly one in four brands — 24.4% — has a click rate below 1%. A click rate below 1% is not just a performance problem. It is a signal of serious audience-content misalignment: the right message is not reaching the right people at the right time. By contrast, 22.6% of brands consistently exceed 5%, demonstrating that high engagement is achievable — it just requires intentional segmentation, offer testing, and content built for the specific audience receiving it.
Finding 6: One in Four Brands Is Actively Burning Its Sender Reputation
The final finding ties everything together, because it explains how so many programs end up stuck in a downward spiral they can't see from the inside.
Across all accounts, the median brand has 33.4% of its actively emailed list classified as not engaged. A full 24.6% of brands are emailing a list that is majority non-engaged — more than 50% cold contacts receiving regular campaign sends.
This is not just a missed revenue opportunity. Every email sent to a disengaged contact increases spam complaint rates, grows suppression lists, and signals to inbox providers that your sending domain is not producing content people want. Brands actively damaging their deliverability will find that even their best campaigns — the ones built for their most engaged subscribers — reach fewer inboxes over time.
The data also reveals two structural failure modes at the extremes. A notable portion of accounts had shut off campaigns entirely, relying solely on automated flows. A larger group had zero flow revenue, running exclusively on campaigns with no automation infrastructure at all. Both represent serious gaps that compound month over month.
What the Top 1% Actually Does Differently
The accounts in this dataset that earned A or B grades share a specific set of observable characteristics. None of them require a larger team or a dramatically bigger budget. They require better data and the discipline to act on it consistently.
Active list management is non-negotiable. Top performers suppress non-engaged contacts aggressively and consistently. They don't let cold subscribers accumulate — they run sunset flows, enforce suppression rules, and maintain sending lists where the majority of contacts have engaged in the last 90 days.
Flow and campaign revenue are balanced. The healthiest accounts don't rely exclusively on broadcast campaigns or automated flows. Top performers generate the majority of their email revenue from automated flows — triggered by behavior like cart abandonment, browse activity, and post-purchase sequences — while still running campaigns that build brand affinity and drive repeat purchase. Both engines need to be running.
They send to smaller, more targeted segments. Top performers often send to fewer contacts per campaign, not more. By targeting engaged segments rather than full lists, every send reaches people who are more likely to click and convert — which drives RPE up and protects deliverability at the same time.
Click rates are consistently above 5%. This is nearly double the median across all accounts. It's not accidental — it reflects intentional audience segmentation, ongoing offer testing, and content that's built for a specific person rather than sent to everyone and hoped for the best.
Non-engaged contact rates are kept well below 30%. High performers protect their sender reputation by ruthlessly removing anyone who isn't engaging, which means every email they do send has a real shot at landing in the inbox and converting.
The Bottom Line: Your Klaviyo Program Is Probably Underperforming — And It's Fixable
The data in this post doesn't exist to make ecommerce marketers feel bad. It exists because the gap between where most Klaviyo accounts are and where they could be is genuinely large — and largely invisible to the people running them.
Most brands don't know their revenue per email sent. Most don't know what percentage of their list engaged in the last 90 days. Most are paying Klaviyo for contacts who will never buy, and sending campaigns that quietly damage deliverability with every blast.
The brands in the top tier of this dataset are not operating with fundamentally different tools or dramatically larger teams. They have better visibility into their list, and they act on what they see. They suppress cold contacts before they become a deliverability problem. They balance flows and campaigns rather than defaulting to one or the other. They measure RPE, not just open rate. They know which segments are ready to buy and which ones need a re-engagement sequence first.
None of that is out of reach. But it starts with an honest look at where your account actually stands — not where you think it stands.
We Help Ecommerce Brands Turn Klaviyo Into a Real Revenue Channel
At Ritner Digital, we work with ecommerce brands that are done leaving email revenue on the table. Whether your list needs a full hygiene overhaul, your flows need to be rebuilt from scratch, or you simply need a partner who can look at your numbers and tell you honestly what needs to happen next — that's the work we do.
If your Klaviyo program isn't performing the way it should, let's talk about what's actually holding it back and what it would take to fix it.
Frequently Asked Questions
What is a good Klaviyo account grade?
Based on the data from 500+ accounts, A and B grades are genuinely rare — only about 1% of brands achieve them. A C grade puts you meaningfully ahead of most competitors. If you're scoring D or below, you're in the majority, but you're leaving measurable revenue on the table every single month. The most common grade in the dataset was D-, earned by roughly 1 in 4 accounts — which means the bar for standing out is lower than most brands assume.
What percentage of my Klaviyo list should be active?
The median across this dataset was just over 5% active in the last 90 days — meaning 95% of the average list is dormant. Best-in-class accounts aim for 20 to 30% or more active engagement within that same window. If your active rate is below 10%, list hygiene should be your first priority before increasing send frequency, running more campaigns, or investing in list growth. Adding contacts to a broken sending environment compounds the problem rather than solving it.
What is revenue per email sent and why does it matter more than open rate?
Revenue per email sent is total email-attributed revenue divided by total emails sent in a given period. It's the most actionable performance metric in email marketing because it ties directly to money rather than engagement signals that may or may not convert. Open rate tells you who noticed the subject line. Revenue per email sent tells you whether your program is actually generating a return. The median in this dataset was $0.06. Top performers hit $1.49. If you're only tracking open rate, you may be optimizing for a metric that has no direct connection to growth.
How much of my ecommerce revenue should be coming from email?
Industry benchmarks from Klaviyo and Litmus consistently place best-in-class email programs at 30% or more of total revenue. The median in this dataset was 15.3% — roughly half of where it should be. If email is generating less than 20% of your revenue, there are almost certainly structural gaps in your segmentation, flow infrastructure, or list quality worth diagnosing before you invest further in the channel.
What causes a low click rate in Klaviyo?
The most common causes are sending to disengaged contacts, weak or nonexistent segmentation, misaligned offers, and infrequent sending to your warm and engaged audience. In this dataset, nearly 1 in 4 brands had a click rate below 1% — a strong signal that the wrong message is reaching the wrong people at the wrong time. The brands consistently above 5% aren't getting lucky — they've built segmentation that puts relevant content in front of people who are ready to engage with it.
How many non-engaged contacts is too many?
The data shows the median brand has 33.4% of its actively emailed list classified as not engaged. When that number exceeds 50% — as it does for nearly 1 in 4 brands in this dataset — you are actively damaging deliverability with every send. A healthy target is keeping non-engaged contacts below 20% of your sending list, achieved through regular suppression and structured re-engagement flows before contacts go fully cold.
Should I focus on automated flows or broadcast campaigns?
Both — and the balance matters. The top-performing accounts in this dataset generate the majority of their email revenue from automated flows, because flows reach the right person at the highest-intent moment: an abandoned cart, a product browse, a lapsed purchase window. But broadcast campaigns still play an important role in building brand affinity and driving repeat purchase behavior. Brands running only campaigns or only flows are leaving one of their revenue engines off. The most effective programs run both with intention.
Why is my Klaviyo bill so high relative to the revenue it generates?
Klaviyo charges by contact count, not by engagement or revenue generated. If your list is 90% or more non-active — as it is for two thirds of brands in this dataset — you are paying every month for contacts who will never convert. Suppressing cold profiles, implementing a sunset flow for subscribers who haven't engaged in 180 days, and segmenting sends to your active audience only can meaningfully reduce your Klaviyo bill while simultaneously improving deliverability and revenue per email sent. It's one of the highest-ROI moves an underperforming email program can make.
How do I know if my sending habits are hurting deliverability?
The signs are often gradual and easy to miss: declining open rates over time even as list size grows, increasing spam complaint rates, emails landing in promotions or spam folders, and suppression lists that keep expanding. Inbox providers like Gmail and Outlook track engagement at the domain level — sustained low engagement trains them to deprioritize your emails across your entire list, not just for cold subscribers. By the time deliverability damage shows up clearly in your metrics, it has usually been building for months.
How can Ritner Digital help with our Klaviyo performance?
We work with ecommerce brands to diagnose exactly where their Klaviyo program is losing revenue — and build a prioritized plan to fix it. That means looking at your actual numbers across list health, flow infrastructure, campaign targeting, deliverability signals, and revenue per email sent, then translating what we find into a clear strategy your team can execute. If you want an honest read on where your program stands and what it would take to move it into the top tier, get in touch and let's talk.