We're Building in Public. Here's Why That's the Point.
Most marketing agencies operate on a principle of selective transparency. They show you the wins. They package the results that made the client happy into a PDF with a nice cover page and a headline metric that looks good in a pitch deck. They talk about strategy in broad strokes and outcomes in carefully chosen specifics. They protect their methodology like it's proprietary technology and their data like it's a trade secret.
We are building something different.
Not because transparency is a marketing tactic — though it happens to be one — but because we believe the agency model is fundamentally broken in a way that selective transparency enables, and we are not interested in perpetuating it.
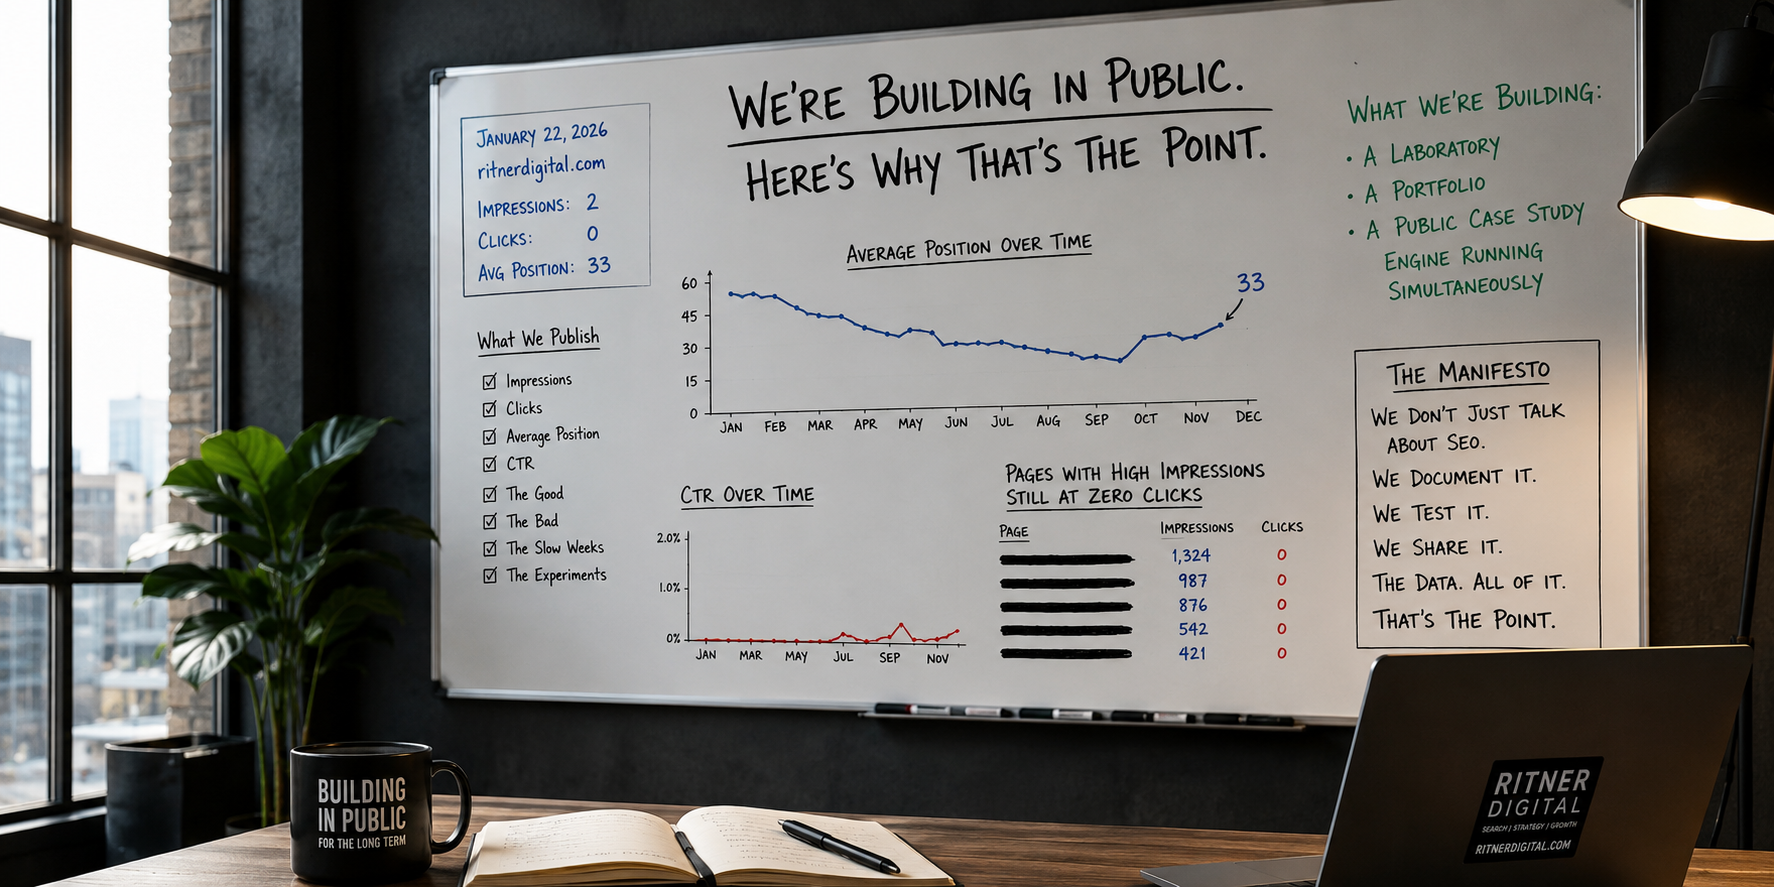
Here is what we are actually building: a laboratory, a portfolio, and a public case study engine running simultaneously, on the same domain, in real time, for anyone to read.
This post is the manifesto for why.
The Problem With How Agencies Present Themselves
The standard agency website follows a predictable structure. A headline about transformation. A services section with confident language about what they do. A case studies page with three or four hand-selected client wins, the metrics scrubbed of context, the client names either redacted or limited to a logo. A testimonials section with quotes that sound like they were written by the agency and approved by a legal department. A contact form.
Nothing on that website tells you what it actually looks like to work with the agency month to month. Nothing tells you what the data looked like before the win. Nothing tells you what the agency does when a campaign underperforms, or how long it actually took to get from zero to the number in the case study headline, or what percentage of their clients see results like the ones featured versus results that are more complicated to frame.
You are being sold a highlight reel. The game footage doesn't exist anywhere you can find it.
This matters more in 2026 than it ever has, for a specific reason: AI search engines are training a generation of buyers to demand specificity. The systems that power ChatGPT, Perplexity, and Google AI Overviews are built to surface content with named claims, specific numbers, verifiable outcomes, and documented methodology. Vague authority signals don't earn citations. Ghost case studies don't build entity authority. The marketing industry's habit of protecting data while claiming expertise is exactly the behavior that makes agencies invisible in the search environment that is replacing the one they optimized for.
We decided early that we were not going to do it that way.
What We Are Actually Building
Ritner Digital launched its blog on January 22, 2026, on a brand new domain with zero history, zero backlinks, and zero authority. No legacy traffic to coast on. No existing domain equity to borrow against. A clean start, documented from day one, published for anyone to read.
What we are building with that foundation is not a content calendar. It is not a thought leadership program. It is not a branding exercise. It is three things simultaneously.
A laboratory. Every piece of content we publish is an experiment. We are testing what ranks, what earns clicks, what generates AI citations, what converts, and what teaches us something about how search actually works in 2026. We have 916 pages indexed across blogs, pricing guides, industry pages, location pages, case studies, and service pages. Each one generates data. The data informs the next decision. We are not doing this in a client sandbox — we are doing it on our own domain, with our own brand on the line, because that is the only way the results mean anything.
A portfolio. The 90-day SEO report card we published on April 22 is not a polished client win. It is a granular, honest assessment of our own performance — every metric graded, every anomaly explained, the uncomfortable numbers included alongside the strong ones. The April 2026 benchmark report we published on May 4 added a client site alongside ours and showed both simultaneously, because context is everything and a single data point is not a case study. This is what our work actually looks like. Not the version we would show in a pitch deck. The actual version.
A public case study engine. Every month we publish, we are building a documented record of what SEO looks like in real time — how long it actually takes, what the data looks like at each stage, what the early wins are and what the persistent challenges are. A business owner reading our 90-day report card gets more honest information about new domain SEO timelines than they would from any agency pitch. A marketing director reading our benchmark report gets a real comparison of what different stages of SEO development look like side by side. We are generating the kind of specific, grounded, externally verifiable content that AI systems cite and that genuine expertise produces — not because we are trying to game a system, but because it is the only kind of content worth producing.
What the Data Has Already Shown
We are not asking you to trust a promise. The data is already there.
On January 22, 2026 — day one — ritnerdigital.com generated 2 impressions in Google Search Console. Zero clicks. Average position 33. That is the honest baseline.
By April 20, 2026 — day 89 — the site generated 1,588 impressions, 7 clicks, and an average position of 18.3. Daily impressions had grown from 2 to over 1,500. Average position had improved by more than 35 points from its worst stretch in mid-March. The daily click rate in the back half of the 90-day period ran at more than double the rate of the first 24 days.
That is not a highlight reel metric. That is 89 rows of daily data, every one of them published, graded, and explained in plain language in a post that anyone can read at any time at ritnerdigital.com/blog/ritner-digital-90-day-seo-report-card-grading-our-own-work.
The April benchmark report added Signed to Keys — a real estate transaction coordination company we manage SEO for — alongside our own numbers, because showing only our site would be showing you only half the picture. Within the first two weeks of active publishing, Signed to Keys was generating 270 daily impressions and ranking at an average position of 10.7 on desktop on its best content. The licensing post — "Do Transaction Coordinators Need a Real Estate License?" — was earning 577 impressions at position 7.6 with a 0.9% CTR. Not a cherry-picked win. A documented early result from a site that is still in its first months, published transparently alongside the things that haven't moved yet.
The gaps are in there too. The marketing retainer pricing page sitting at 8,521 impressions with 0 clicks and a position of 20.1 — close to page one, not yet there. The SEO cost guide buried at position 88. The CTR we know should be higher on several high-impression pages and isn't yet. We published all of it.
Because that is what building in public actually means.
Why This Is the Only Model That Makes Sense
There is a strategic argument for what we are doing, and there is a values argument. Both are real.
The strategic argument is this: the search environment that is emerging rewards exactly what selective transparency prevents agencies from producing. AI search systems cite sources with named claims, specific numbers, documented methodology, and external validation. Research into AI citation behavior consistently shows that content with specific, grounded claims earns citations at significantly higher rates than content with vague or unverifiable assertions — and that brands referenced across four or more independent sources are 2.8 times more likely to appear in ChatGPT responses than brands mentioned only on their own website.
An agency that publishes real data — including data that shows work in progress — builds the entity authority, the external citation signals, and the topical depth that AI systems need to confidently recommend them. An agency that publishes polished case studies with redacted client names and aggregate metrics builds none of those things, because those documents are not citable. They are marketing collateral.
We are building something that is citable. Something that earns its authority rather than claiming it.
The values argument is simpler. We think the businesses we want to work with deserve an honest picture of what SEO actually looks like — not the timeline an agency promises in month one when they are trying to close a deal, but the timeline that 90 days of daily GSC data actually shows. According to Google's own guidance, new websites typically take four months to a year before SEO efforts produce significant results — which means the first 90 days are about establishing a trajectory, not achieving a destination. We think the industry's habit of selecting only the wins for public display and hiding the process behind proprietary language is a disservice to clients who are making real financial decisions based on incomplete information.
We are not interested in winning clients by showing them only our best months. We are interested in winning clients who understand what the process looks like, trust that we will show them the real numbers, and want to build something with us that compounds over time. Those clients exist. They are reading our data right now.
What You Can Find Right Now
The laboratory, the portfolio, and the case study engine are already running. Here is what is publicly available.
The 90-Day SEO Report Card
The most granular public document we have published. 89 rows of daily Google Search Console data from January 22 through April 20, 2026. Every metric graded. Three distinct stories identified in the daily data — the early raw period, the February inflection point, and the March impression explosion and subsequent position recovery. The four key metrics — 101,000 impressions, 218 clicks, 0.2% CTR, average position 38 — each given their own honest grade and the context to understand what that grade actually means for a new domain at 90 days. The five specific opportunities entering day 91. The three tactical priorities for days 90 through 180. Every uncomfortable number included.
If you want to understand what new domain SEO actually looks like from day one — including the Google sandbox effectthat most agencies never explain to new clients — this is the most honest document you will find from any agency operating in this space. Research from Ahrefs examining organic traffic patterns across millions of URLs confirms that the vast majority of pages that eventually rank in Google's top ten took more than a year to get there — which makes early-stage data like ours genuinely rare to find published openly.
The April 2026 SEO Client Benchmark Report
The first edition of what we are publishing monthly: our own site's data alongside an active client site, side by side, with honest analysis of what the comparison reveals. This edition covers our 90-day trend across three distinct performance phases, the device split showing mobile CTR outperforming desktop by 2.5 times, the top pages earning actual clicks versus the high-impression pages not yet generating them, and Signed to Keys' first two weeks of indexed content producing consistent daily impressions and a best-post CTR of 0.9% at position 7.6.
The bigger picture section of that report covers four structural trends in 2026 search — zero-click behavior, the volume versus quality debate, pricing content as a moat, and the growing share of long-tail conversational queries — with our own data as the evidence base. SparkToro's research on zero-click search consistently confirms that a significant and growing share of Google searches now end without any organic click — which makes the impression-to-click relationship in our data a useful real-world illustration of what that trend looks like for a content-first site.
More editions are coming. Every month. With updated numbers, honest reads on what changed, and the same willingness to show the things that haven't moved yet alongside the things that have.
What We Are Building Toward
The 90-day report card is phase one. The benchmark report is the beginning of a monthly publication cadence. What comes next is a documented arc — 180 days, 270 days, one year — that shows in granular, cited, honest detail what it looks like to build an SEO and GEO program from zero to a primary lead channel.
We are also building toward something larger than the data. We are building toward a model for what an agency can be in an environment where AI search rewards transparency, specificity, and genuine expertise over polished marketing language. Where the agencies that win are the ones whose content gets cited, whose claims are verifiable, whose results are documented, and whose process is something a potential client can evaluate before they ever pick up the phone.
The distinction we keep returning to is the one between a site that has a lot of content and a site that search engines and AI systems recognize as an authority entity. We've written about this directly — and the building-in-public model is our answer to it in practice. Every data report we publish, every honest grade we assign our own performance, every client result we document in real time is a piece of the entity we are building. Not the entity we claim to be. The entity that the evidence supports.
According to research from LLMrefs on how AI systems evaluate brands for citation, the frequency with which a brand appears in AI-generated answers is not driven by a single strong piece of content — it is driven by a consistent, coherent presence across many sources, many formats, and many contexts over time. That is what a monthly public benchmark report builds. That is what a 90-day data deep dive contributes. Each piece of published, specific, honest content is another data point that AI systems can use to build confidence about what Ritner Digital is and what it is qualified to say.
We are aware that this model is a bet. Publishing your own performance data — including the months when the numbers are not as strong as you want them to be — is not how most agencies operate. It requires believing that the clients worth having are the ones who value honesty over highlight reels — and that there are enough of those clients to build a business worth having.
We believe that. And we are building accordingly.
The Invitation
If you are reading this, you are already part of the experiment. You found this post through some combination of search, referral, or recommendation — and now you know what we are doing and why.
If you are a business owner who has been pitched by agencies showing you polished case studies you cannot verify, and you have wondered what the process actually looks like underneath the highlight reel — the 90-day report card answers that question more honestly than any pitch deck will.
If you are a marketing director trying to explain to leadership why SEO takes time and what the early data should actually look like before results compound — the benchmark report gives you the real timeline with real numbers attached.
If you are evaluating agencies and trying to figure out which ones are worth trusting — we would rather earn that trust through documented data than claim it through selected wins. Here's what we think the clearest sign of an agency actually doing its job looks like — and you can measure us against it.
The laboratory is open. The data is live. The next report publishes next month.
If you want to build something with us, start here. →
Internal resources referenced in this post:
You Don't Have a Content Problem. You Have an Entity Problem.
The Clearest Sign Your Marketing Agency Is Actually Doing Its Job
How Long Does It Take to See Results From a New Marketing Agency
External sources referenced:
Frequently Asked Questions
Why are you publishing your own Google Search Console data publicly?
Because we think it is the most useful thing we can do for the people we are trying to reach — and because we believe the selective transparency that defines most agency marketing is a disservice to the businesses making real decisions based on it. When we publish 89 rows of daily GSC data including the days with zero clicks and position 60, we are giving you something no pitch deck gives you: an honest picture of what the process actually looks like at every stage, not just the stage that photographs well. The strategic benefit is real too. Specific, grounded, documented content earns AI citations. Ghost case studies do not. But the honest answer is that we started doing this because it felt like the right thing to do, and the strategic benefits followed from that.
Doesn't publishing your own performance data hurt you competitively if the numbers aren't always strong?
The opposite, and here is why. The businesses we want to work with are the ones sophisticated enough to look at a domain that went from 2 impressions on day one to 1,500 daily impressions by day 90 and understand that as a trajectory worth trusting — not a total worth dismissing. Any agency can show you a month where the numbers look good. Almost no agency will show you the month where average position hit 60.8 and explain exactly why that happened and why it was actually a sign of growth rather than failure. That explanation is worth more than a polished case study to a business owner who has been burned by agencies that overpromised and underdelivered. We are self-selecting for clients who want the real picture. That is not a vulnerability. It is a filter.
What is the difference between what you are building and what a typical agency blog does?
A typical agency blog publishes thought leadership — opinion pieces, industry trend summaries, how-to guides, and the occasional case study featuring a client who approved the metrics for public use. What we are publishing is different in kind, not just degree. Our 90-day report card is primary source data — 89 rows of daily Google Search Console numbers, graded and explained, with the uncomfortable results alongside the strong ones. Our benchmark report puts a client site's data next to ours and compares them without selecting for the comparison that makes us look best. No agency blog we are aware of is doing this at this level of granularity with this degree of honesty. That gap is intentional and it is the point.
How does publishing this data help you get cited by AI search engines?
AI search systems cite sources they can trust — and the trust signal that matters most is specificity. A piece of content that says "new domains typically take time to build authority" is a generic claim that any site can make. A piece of content that says "on January 22, 2026, this domain generated 2 impressions and zero clicks, and by April 20 it generated 1,588 impressions at an average position of 18.3" is a citable, verifiable, primary source claim that no other site can replicate. Research into AI citation behavior consistently finds that content with original data, specific numbers, and named methodology earns citations at meaningfully higher rates than content making the same points in general terms. Every data report we publish is designed to be the kind of content that AI systems have no choice but to treat as authoritative — because nobody else has the data.
Why did you choose to include a client site in the benchmark report rather than just showing your own numbers?
Because a single data point is not a benchmark. Our site tells one story — an agency blog launched from zero, publishing aggressively across a wide topic range, building a broad content library. That story is useful but incomplete. Signed to Keys tells a different story — a new site in a specific niche, two anchor posts doing the majority of early work, strong early positions against a small but growing query footprint. Showing both side by side makes the data more useful to more readers. A business owner with a new site in a competitive niche gets more from the Signed to Keys comparison than from ours. A marketing director evaluating a content-heavy strategy gets more from ours. The benchmark report is meant to be a reference document, not a promotional one. Two sites make it a reference. One site makes it a portfolio piece.
What happens when your numbers have a bad month?
We publish it. That is not a hypothetical — our March data included days at position 60.8, multiple days with zero clicks against more than 1,700 impressions, and a position trajectory that looked like it was getting worse before it got better. We published all of it in the 90-day report card and explained specifically why it was happening and why it was actually evidence of growth rather than failure. The explanation required understanding how a domain's query footprint expands during the sandbox period and why that expansion temporarily pulls average position down even as visibility is increasing. That explanation is more valuable to a reader than a month where everything moved in the right direction would have been. Bad months produce the most instructive data. We are not going to hide the instructive data.
Is this model something other agencies should adopt?
We think so, but we also understand why most of them won't. Publishing real performance data requires confidence that your work is good enough to survive scrutiny over time — not just in the months that look strong, but in the months that are complicated to explain. It requires a client roster that trusts you enough to allow their data to appear publicly alongside yours. It requires an editorial commitment to honesty that is genuinely hard to maintain when a month of flat traffic lands right before a reporting deadline. Most agencies are not structured to absorb those requirements. We built ours around them from the start, which is why we can do this and why the agencies that have been operating for years on the highlight reel model would find it difficult to pivot.
How do I know the data you are publishing is real and not selectively edited?
You can verify it. Our Google Search Console data is sourced directly from Google's reporting tool and we have published the raw daily numbers — every row, every date, including the dates with zero clicks and zero CTR and positions deep in page four. The aggregate numbers we cite in analysis are simple arithmetic from those rows, which you can check yourself. For the client data, we have the client's consent to publish and the same direct access to their Search Console property. We are not asking you to trust that we are being honest. We are asking you to look at the data and verify it. That is the whole point of publishing it.
How often will you publish these reports and what will they cover over time?
The benchmark report publishes monthly. Each edition will include updated data from ritnerdigital.com and at least one client site, with honest analysis of what changed, what is working, and what isn't moving yet. Over time the reports will build into a longitudinal record — 90 days, 180 days, 270 days, one year — that documents in real time what a content and SEO program looks like as it matures from a new domain through the sandbox period and into compounding organic growth. We will also add client sites as we bring on new engagements and get consent to publish, which means the benchmark comparisons will become richer as the dataset grows. The goal is to make these reports genuinely useful reference documents for anyone trying to understand what SEO timelines actually look like in practice — not what agencies claim they look like in pitch decks.
What does "building toward category definition" actually mean for a marketing agency?
It means becoming the brand that gets cited when someone asks an AI or a search engine who the serious operators in SEO and GEO are — not through paid placement or manufactured authority, but through a documented body of work that is specific enough, honest enough, and original enough that the systems doing the citing have no better option. Category definition in the current search environment is not about being the biggest or the loudest. It is about being the most verifiable. The most cited. The most specifically documented. Every data report we publish, every honest grade we assign our own performance, every client result we document without sanitizing it is a piece of evidence in the case for why Ritner Digital belongs at the center of the conversation about what serious SEO and GEO practice looks like in 2026. We are not claiming that position. We are building the record that supports it.