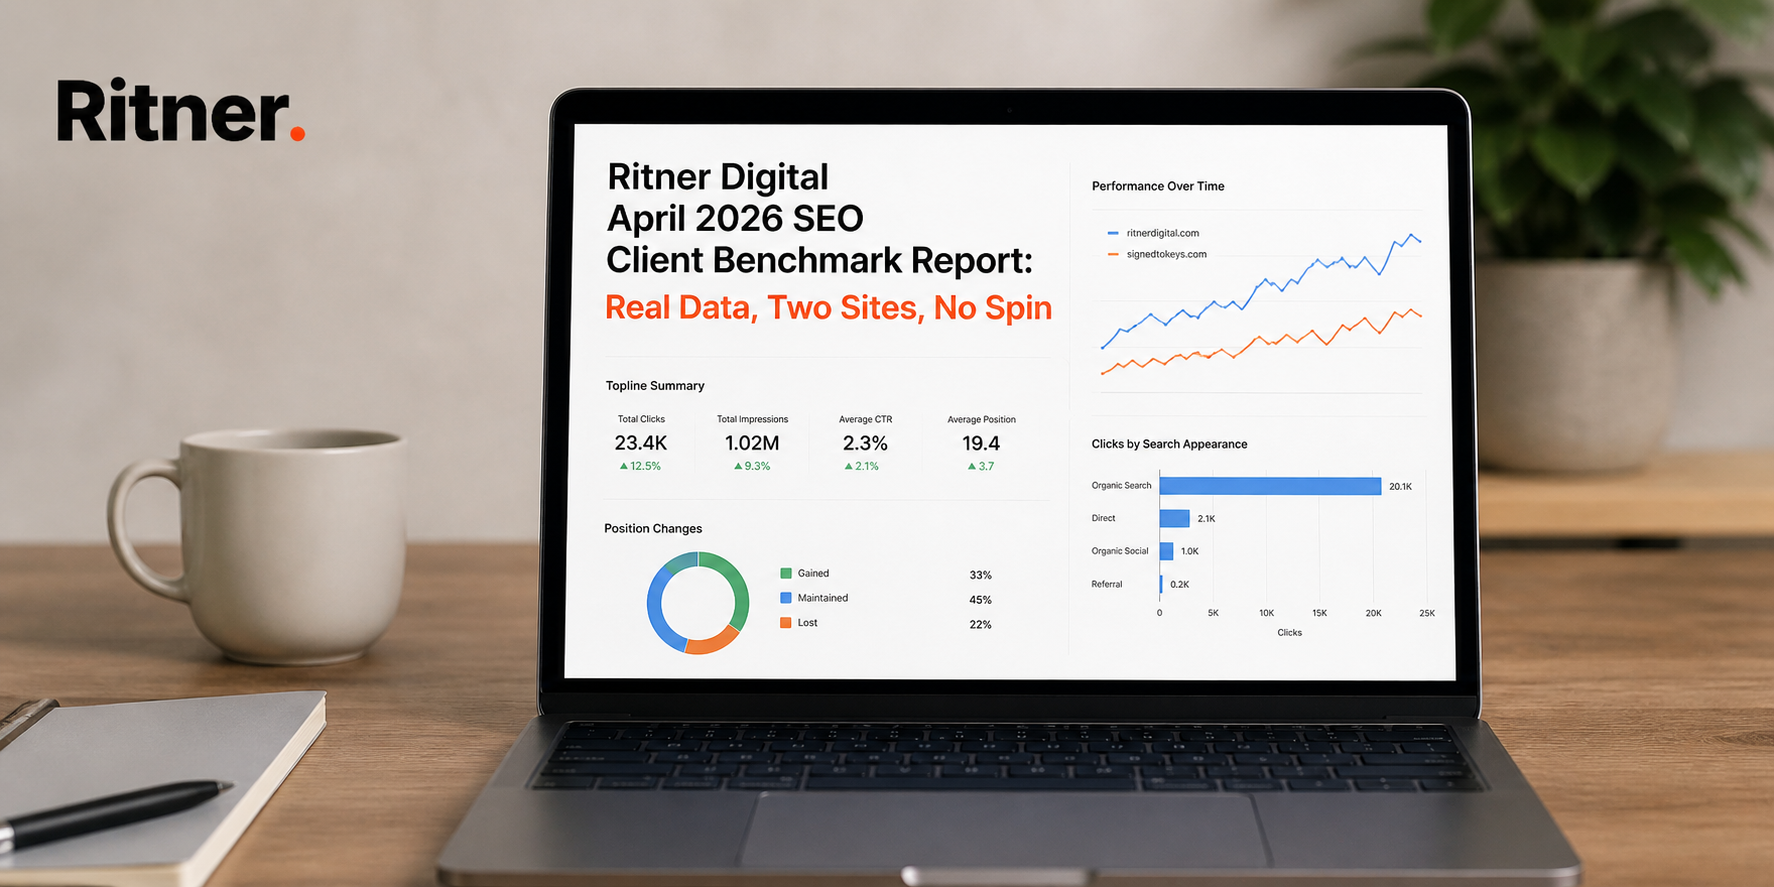
Ritner Digital: April 2026 SEO Client Benchmark Report
We don't believe in hiding the scoreboard.
If we're going to talk about SEO — about what's working, what's not, and what the data actually means in a world where AI is quietly reshaping how search works — we should be willing to show you our own numbers. Not just client wins packaged into a PDF nobody reads. Our numbers. Live. Warts and all.
This is the first edition of what we're turning into a regular publication: the Ritner Digital SEO Client Benchmark Report. Each edition uses real Google Search Console data from our own site — ritnerdigital.com — and at least one client site we actively manage. We show you both because context is everything. A number without a comparison is just a number.
This month's client site is Signed to Keys (signedtokeys.com), a real estate transaction coordination company. They're a newer site. We started managing their SEO recently. The contrast between where they are and where we are tells a story that matters for any business thinking about what SEO actually looks like in practice.
Let's get into it.
Why We're Publishing This
The marketing industry has a transparency problem. Agencies love to show you the wins. The client who went from 200 to 20,000 monthly visitors. The blog post that ranked #1 in six weeks. The campaign that generated 400 leads. Those stories are real — but they're selected. Nobody shows you the months where impressions flatlined, or the keywords sitting at position 86 that aren't moving, or the CTR that should be higher and just isn't yet.
We think that's wrong. And we think publishing our own data — including the uncomfortable parts — is one of the most useful things we can do for the people we're trying to reach.
So here's the deal with this report: we're showing you the actual numbers, the actual trend lines, and our actual read on what they mean. We'll cite external research where it's relevant. We'll be honest about what we don't know. And we'll do this every month so you can watch the story develop in real time.
This is building in public. Let's go.
Site #1: Ritner Digital (ritnerdigital.com)
The Agency's Own Numbers — April 2026
Reporting period: February 3, 2026 – May 2, 2026 (90-day trend) plus a 28-day deep dive on April's query and page data.
The Headline: A Position Collapse — In the Good Way
The single most important story in our data right now isn't clicks. It's average position, and what happened to it between February and the end of April illustrates how SEO actually builds.
Here's what the 90-day trend looked like across three distinct phases:
If that sounds confusing, here's the plain-English version: early February's good positions were happening against tiny impression volume. The site wasn't being shown for much. As we published more content and indexed more pages, Google started showing the site for a much wider range of queries — including ones where we didn't yet rank well. That temporarily pulled average position down. Then, as those pages aged and built authority, positions improved. By late April we were ranking better and being shown for far more searches simultaneously.
This is a pattern that trips up a lot of business owners and marketers. They see average position drop and assume SEO is getting worse. Often the opposite is true.
28-day April summary:
The CTR drop is real and worth talking about honestly. We'll get to it.
The Device Split: Where Desktop Dominates
Over the 28-day April window:
Desktop is doing the heavy lifting on impressions — 44,040 vs. 3,374 on mobile. This makes sense for a B2B agency site. The people searching for "marketing retainer pricing," "how long does it take to see results from a new marketing agency," or "asana vs monday vs clickup for marketing teams" are largely doing so at a desk, during business hours, in a work context.
The mobile CTR is actually higher (0.9% vs 0.2%) despite worse average positions. When mobile users do find us, the intent match seems strong. But the 16-point position gap between desktop (20.0) and mobile (36.0) suggests our pages are ranking meaningfully better in desktop results — common for content-heavy sites that haven't gone deep on mobile-first optimization.
Top Pages: What's Actually Driving Traffic
These were the pages earning clicks in April. Not impressions — clicks. Actual humans choosing to visit.
The sitemap/internal linking post has the highest non-branded CTR at 4.4% with a position of 7.4. High CTR at position 7 means the title and meta description are punching above their weight. The Claude Sonnet 4.6 post has the highest CTR of any content piece at 7.5% — a clear signal that AI model content is generating genuine curiosity clicks right now.
The Impression Giants with Zero Clicks: The CTR Problem
Here's where it gets honest. We have a significant number of high-impression pages that are not generating clicks.
These fall into two buckets. Bucket 1: High impressions, decent position, low CTR — Google's AI Overview may be answering the question before anyone clicks. Bucket 2: High impressions, terrible position — the SEO cost guide at position 84.1 simply hasn't broken through yet and needs content or link work before it moves.
Top Queries: What People Are Actually Searching
The query data from the 28-day window shows over 1,000 unique queries generating impressions. Here are the most important clusters:
Pricing queries are everywhere, GEO queries are emerging fast, and long conversational queries are growing — a direct result of AI chatbots training people to ask full, detailed questions that now spill into Google search behavior.
Site #2: Signed to Keys (signedtokeys.com)
A New Site Finding Its Footing — April 2026
Reporting period: April 17, 2026 – May 2, 2026
Signed to Keys is a real estate transaction coordination company. Transaction coordinators handle the administrative side of real estate deals — managing deadlines, paperwork, compliance, and communication between agents, lenders, title companies, and clients. It's a growing niche as agents look for ways to scale without drowning in paperwork.
The Snapshot: Early Traction, Strong Content Foundation
For a new site in a competitive niche, showing up consistently at position 10–12 within the first few months is a genuinely solid early result. The clicks are low — but that's completely expected. You need impressions before you get clicks, and you need consistent impressions before clicks become reliable.
The device split:
Unlike the Ritner site, the position gap between desktop and mobile is just 1.8 points (10.7 vs 12.5). Real estate professionals are mobile-first. The site is performing accordingly.
Daily Impression Trend: The First 16 Days
April 17 is essentially zero. By April 19 — two days later — 160 impressions appear and the first click happens. By April 21 and May 1 the site is hitting 270+ impressions in a single day. This is what early-stage SEO indexing actually looks like.
Top Pages: Two Posts Are Doing the Work
The licensing post is the standout — 577 impressions at position 7.6 with a 0.9% CTR is strong early performance. Content that answers a specific, complex regulatory question tends to rank well because Google values genuine utility. The attorney review NJ post sitting at position 4.7 with zero clicks is the puzzle to solve: great position, no click. We'll be testing the search appearance on that one in May.
Top Queries: The Niche Is Clear, the Volume Is Building
Licensing questions are the biggest driver. Comparison queries are showing up early. Cost queries are emerging. All three are exactly the right query types for a service business trying to earn trust at the research stage.
Comparing the Two Sites: What the Data Says Side by Side
Better average position doesn't automatically mean more traffic. Signed to Keys has a meaningfully better average position (10.7 vs 20.0 on desktop), but Ritner has dramatically more impressions and clicks because the content library is larger and the site has more authority overall. Both things matter. Position without impressions doesn't move the needle. Impressions without clicks are a missed opportunity.
The Bigger Picture: What April 2026 Tells Us About Where SEO Is Heading
Zero-Click Search Is Not Going Away
The most consistent signal across both sites is the gap between impressions and clicks. Tens of thousands of impressions per month, click-through rates in the fractions of a percent on most content. This isn't a failure of our titles. It's a structural feature of modern search. Google's AI Overviews are designed to answer questions without requiring a click, and research from SparkToro and others studying zero-click search behavior has consistently found that queries with AI Overviews generate lower organic CTR. That trend is accelerating.
Getting clicked is no longer the only goal. Getting cited — having your content referenced within AI summaries, knowledge panels, and AI Overview answers — is increasingly valuable even when it doesn't produce a direct click. This is why GEO (Generative Engine Optimization) has emerged as a discipline alongside traditional SEO.
The Content Volume vs. Quality Debate Is Over — You Need Both
Our Ritner data shows what happens when you publish consistently across a wide range of relevant topics: impression volume scales. The Signed to Keys data shows that quality on a small number of posts can earn strong early positions even without volume. The answer isn't volume OR quality. It's both, sequenced correctly. Nail a handful of specific, high-intent topics first. Then build volume around the authority those posts establish.
Pricing Content Is a Reliable Traffic Strategy in 2026
Across both sites, pricing-related queries generate disproportionate impression volume. Most businesses avoid publishing transparent pricing content because it feels risky. That reluctance is a competitive advantage for the businesses willing to be transparent. Pricing content is a moat, and most businesses aren't building it.
Long-Tail, Hyper-Specific Queries Are Growing — and AI Is the Reason
AI chatbots have trained people to ask full, detailed, conversational questions — and that behavior is now spilling into Google search. Long-form, question-answering content that addresses specific, nuanced topics is increasingly what Google rewards. Short, keyword-stuffed articles won't rank for the conversational queries now making up a growing share of search volume.
The Lag Between Impressions and Results Requires Patience
The results you see in month one look nothing like the results you see in month six. The Ritner data proves this in real time — roughly a 6x increase in daily impressions in about 90 days. According to research from Ahrefs examining organic traffic patterns across millions of URLs, the vast majority of pages that eventually rank in Google's top 10 took more than a year to get there. The sites that win are the ones that don't stop publishing when month two doesn't look like a breakthrough.
What We're Watching in May
For Ritner Digital:
For Signed to Keys:
The Honest Bottom Line
SEO in 2026 is harder to understand than it used to be — because the relationship between effort and output has more steps and longer lag times than it did when ranking #1 meant a flood of clicks. The playbook has changed: you need to rank and get cited, earn impressions and earn clicks, publish consistently and publish well.
But the fundamentals haven't changed at all. Google still rewards content that genuinely answers real questions from real people. It still rewards sites that demonstrate topical expertise consistently over time. It still rewards patience — the kind that most businesses don't have, which is why most businesses don't win.
We're building in public because we believe the process is worth showing. We'll be back next month with updated numbers and an honest read on what changed.
Work With Us
If you're looking at your own Google Search Console data and it's not telling a story you like — or if you don't have a clear read on what the numbers mean — we'd like to talk.
Ritner Digital manages SEO, content strategy, paid media, and full-funnel digital marketing for businesses across industries. We don't hide our own data, and we won't hide yours.
Get in touch at ritnerdigital.com/#contact
Data sourced directly from Google Search Console for ritnerdigital.com and signedtokeys.com. External research referenced includes SparkToro's zero-click search studies, Google's helpful content documentation, Ahrefs' organic traffic timeline research, and Search Engine Journal's reporting on AI Overview CTR impact.
Frequently Asked Questions
What is the Ritner Digital SEO Client Benchmark Report?
It is a monthly public report where we share real Google Search Console data from our own agency site and at least one client site we actively manage. No cherry-picked wins, no vanity metrics — just actual numbers, honest analysis, and what we are doing about what we find. We publish it because transparency makes us better and makes our clients smarter.
Why is your CTR so low if you have tens of thousands of impressions?
Because impressions and clicks are two very different things in 2026. A large share of Google searches — especially informational ones — now end without anyone clicking a website at all. Google's AI Overviews, featured snippets, and knowledge panels answer the question directly in the search results. A 0.2% CTR on broad informational content is not a red flag. It is a reflection of how search behavior has structurally changed. The goal is not just to rank anymore — it is to be cited inside those AI answers so your brand earns awareness even when nobody clicks.
Why did your average position drop in February and March before improving in April?
This is one of the most misunderstood patterns in SEO. When you publish a lot of new content, Google starts showing your site for a wider range of queries — including ones where you do not yet rank well. That pulls your average position down even as your overall visibility is actually growing. As those pages age and build authority, positions improve. By late April we were ranking better than we were in February against a baseline of impressions more than six times larger. The dip was growth, not decline.
What is Signed to Keys and why are you including a client site in this report?
Signed to Keys (signedtokeys.com) is a real estate transaction coordination company we manage SEO for. We included them because a single-site report gives you half the picture. Showing a new site alongside an established one lets you see how SEO actually develops at different stages — what early traction looks like, what the first anchor posts accomplish, and how long it takes for impressions to become clicks. It makes the data more useful for anyone trying to figure out where they are in their own SEO journey.
How long does it take for a new site to start seeing SEO results?
The Signed to Keys data gives you a real answer. Within the first couple of months of active publishing the site was generating consistent daily impressions in the 100 to 270 range and ranking in the 7 to 12 position range on its best content. Clicks were minimal — but the foundation was being built. According to Ahrefs research on organic traffic timelines, most pages that eventually reach Google's top 10 take over a year to get there. Early results look like impressions. Later results look like traffic. Patience is not optional.
What is GEO and why does it keep coming up in your data?
GEO stands for Generative Engine Optimization. It is the practice of optimizing your content so it gets cited by AI-powered search tools — ChatGPT, Perplexity, Google's AI Overviews, Microsoft Copilot — not just ranked in traditional blue-link results. Queries like "generative engine optimization services" appearing in our data with 381 impressions reflect a growing number of businesses realizing that being invisible in AI search is a real problem. GEO is where traditional SEO is heading and it is something we are building into our strategy for both our own site and our clients.
Why does pricing content generate so many impressions?
Because people search for pricing constantly and most businesses refuse to publish it. That reluctance creates a gap in search results that transparent, well-structured pricing content fills instantly. When you are one of the few sources willing to explain what something actually costs — and why — Google rewards you with impressions from every buyer in the research phase. It also earns trust faster than almost any other type of content. Pricing transparency is a competitive advantage in SEO, not a liability.
What is the difference between impressions and clicks in Google Search Console?
An impression means your page appeared in Google search results — someone's screen showed it whether or not they scrolled to it or noticed it. A click means someone actually tapped or clicked your result and landed on your page. CTR is the ratio of clicks to impressions. A page with 1,000 impressions and 10 clicks has a 1% CTR. Most pages have CTRs well below that, especially on informational content, which is why impression growth and click growth do not always move in sync.
Why does Signed to Keys have a better average position than Ritner Digital but far less traffic?
Because position and traffic are not the same thing. Signed to Keys ranks at an average position of 10.7 on desktop compared to 20.0 for Ritner Digital — but it is showing up for 107 unique queries against Ritner's 1,000 plus. Better position on a small number of queries produces less total traffic than a slightly lower position across a much broader content library. As Signed to Keys publishes more content and builds topical authority, that query count will grow and traffic will follow.
What is the mobile position gap you mention for Ritner Digital and why does it matter?
Ritner Digital ranks at position 20.0 on desktop and 36.0 on mobile — a 16-point gap. Signed to Keys has almost no gap at all (10.7 desktop, 12.5 mobile). Google's index is mobile-first, meaning it primarily uses the mobile version of your site to determine rankings. A large desktop-to-mobile gap suggests the site's content or technical setup is performing differently on mobile devices. For a B2B agency site this is less urgent than it would be for a consumer brand, but it is something we are actively working to close.
How do I know if my own SEO is actually working?
Look at the trend, not the snapshot. A single month of Google Search Console data tells you almost nothing useful. Three months of data starts to show whether impressions are growing, whether positions are moving, and whether clicks are following. The questions to ask: Are daily impressions trending up? Are average positions improving on your most important pages? Are the queries you are showing up for getting more relevant over time? If the answers are yes, SEO is working — even if it does not feel like it yet.
Will you publish this report every month?
That is the plan. We want to show the full arc — not just the months where the numbers look good. Future editions will track whether CTR improves on the pages we are optimizing, whether Signed to Keys' impressions convert to clicks as the site matures, and what happens to both sites as AI search continues to evolve.
How do I work with Ritner Digital?
Start at ritnerdigital.com/#contact. Tell us where you are — whether you have GSC data you do not know how to read, a content strategy that is not producing results, or you are starting from scratch — and we will tell you honestly what we think the path forward looks like.