Ritner Digital 90-Day SEO Report Card: Grading Our Own Work
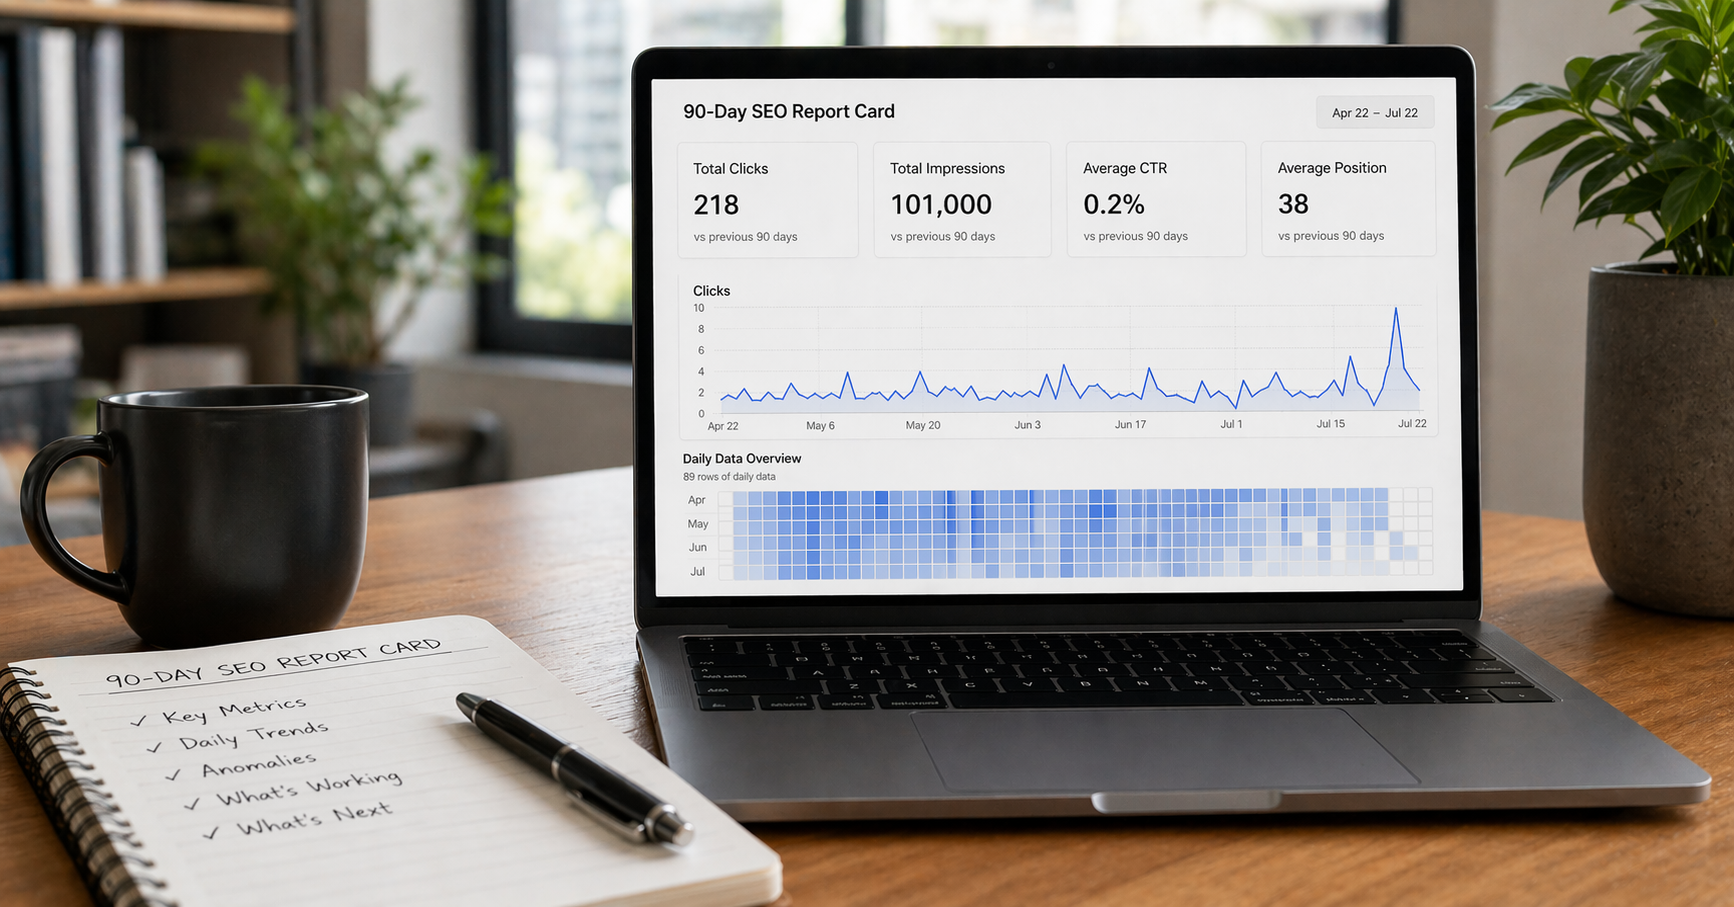
Today is exactly 90 days since Ritner Digital's blog went live on a brand new domain with zero history, zero backlinks, and zero authority. Just content, strategy, and consistency.
So how are we doing? Here's the honest grade — no spin, no cherry-picking, no vanity framing. Just a straight read of what 89 days of daily GSC data actually means, measured against real new-domain benchmarks.
The Four Numbers
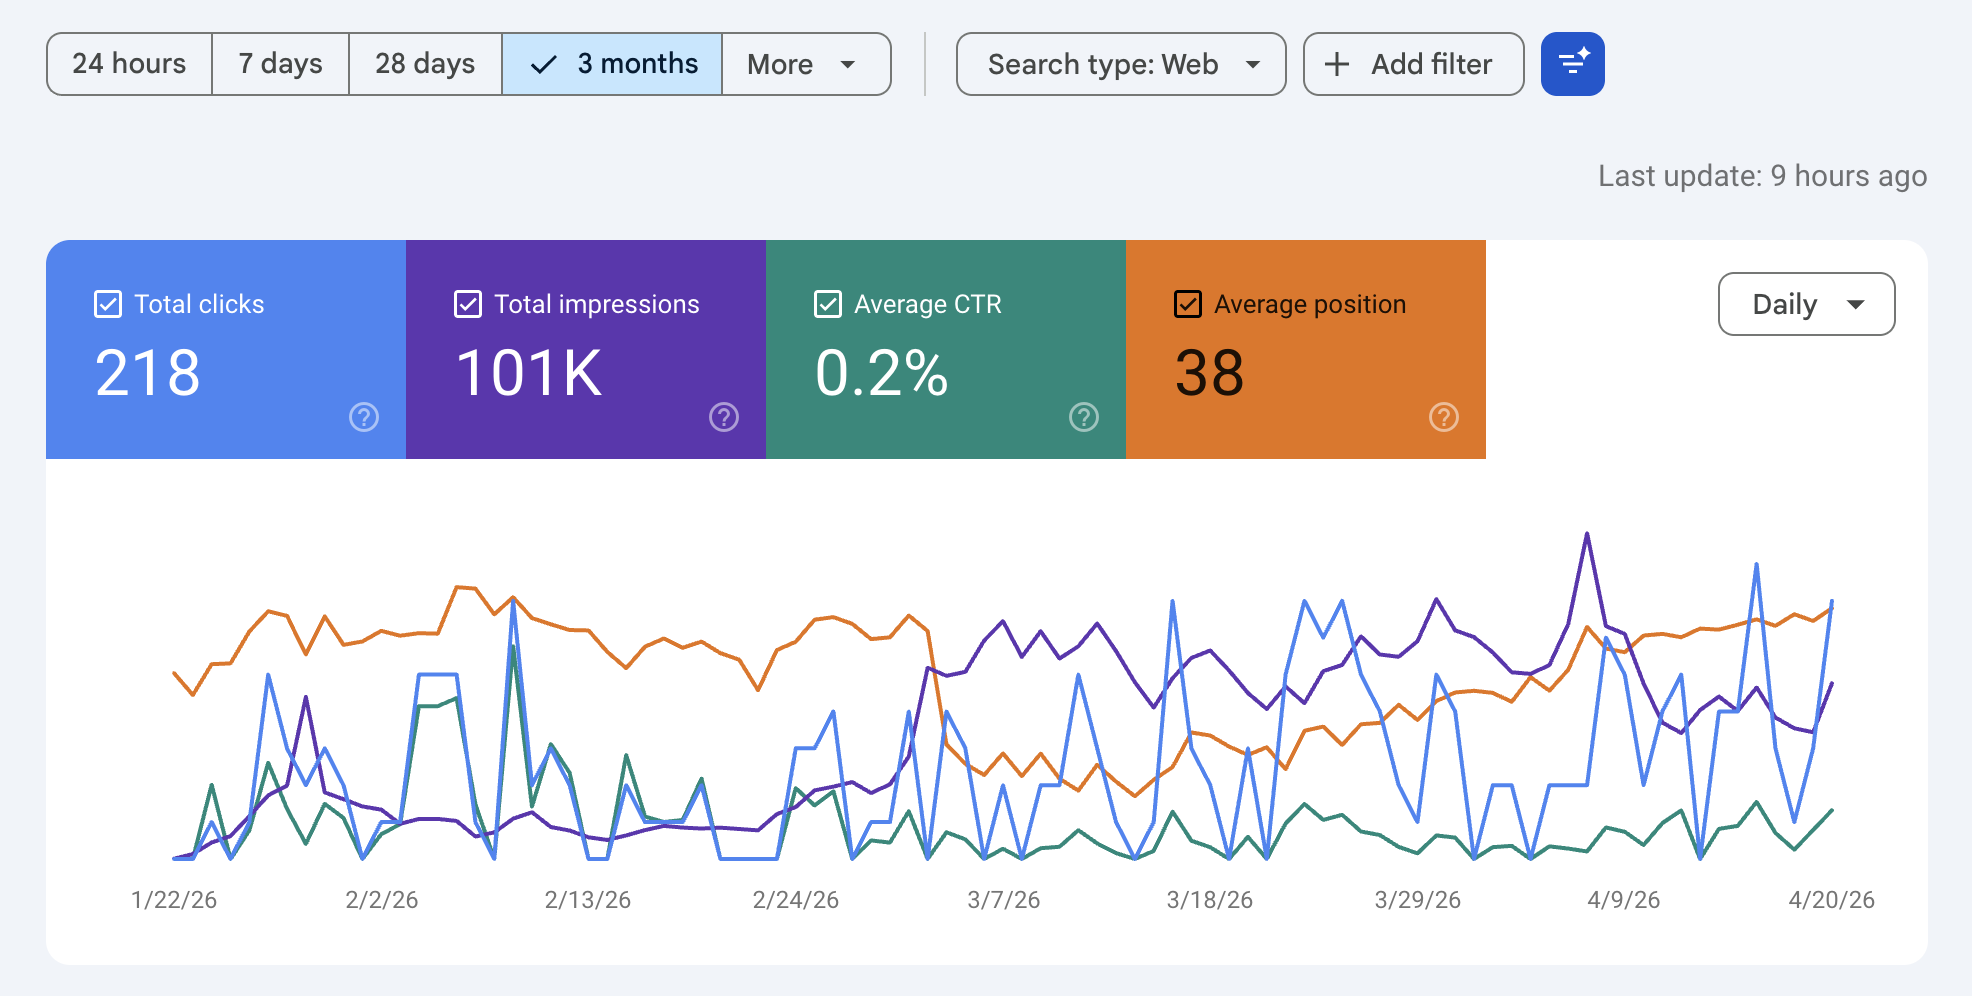
Total Clicks: 218
Total Impressions: 101,000
Average CTR: 0.2%
Average Position: 38
Each means something different. Each needs its own grade. And the daily data table tells a story the headline numbers alone completely obscure.
Before the Grades: What the Daily Data Actually Shows
Most 90-day SEO reviews look at aggregate numbers and call it done. We have 89 rows of daily data, and that granularity tells three distinct stories about how this domain has evolved.
Story 1: The first two weeks were genuinely raw.
January 22: 2 impressions. Zero clicks. Position 33.
That's not a typo. Day one of a brand new domain produced 2 impressions. By January 25, impressions were still only 207. Google had found the site but had almost no opinion about it. This is the baseline everything else is measured against.
Story 2: A sharp, dramatic inflection happened around February 3–10.
Something significant happened in the first week of February. On February 9, CTR hit 1.9% — the highest single-day CTR of the entire 90-day period — at an average position of 15.9, the best single-day position of the entire period. February 6 posted 1.5% CTR at position 13.6. February 11 hit 1.0% CTR at position 22.
This wasn't random noise. This was Google testing specific content in high positions and observing click behavior. The content earned it momentarily — and then, as is completely normal for new domains, Google pulled it back to recalibrate. Google often deliberately shifts pages up and down after big changes to test how they perform for searchers. This trial period can last 60 to 90 days, and rankings might dip before they improve. Shopify
Story 3: A massive impression explosion in early March, followed by a position improvement that is still accelerating.
March 3–4 are the most interesting data points in the entire table. On March 3, impressions jumped to 1,728 at position 23.5. On March 4, 1,655 impressions at position 49.1. This was the moment the domain crossed a threshold — Google began serving our content across a dramatically wider range of queries simultaneously. Impressions never fell back below 1,000 after that point.
From that March inflection forward, two things happened in parallel: impressions stabilized at a much higher floor (1,000–2,000+ per day versus the 200–700 range of January–February), and average position began a consistent downward trend. By mid-to-late April, daily positions were regularly hitting the 18–24 range — a 20+ point improvement from the 49–60 range of mid-March.
That is not a coincidence. That is a domain earning trust.
Metric 1: Total Impressions — 101K
Grade: A
101,000 impressions in 90 days on a brand new domain is strong. But the headline number undersells the real story, which is the rate of acceleration.
January average daily impressions: ~400
February average daily impressions: ~370(early content testing phase)
March average daily impressions: ~1,750
April 1–20 average daily impressions: ~1,600
The jump from February to March is roughly a 4x increase in daily impressions. That's not gradual growth — that's an inflection point. Something in late February and early March caused Google to dramatically expand the range of queries for which it was serving Ritner Digital content.
At month 3, you should see consistent impressions and first-page movement for some long-tail queries, plus early non-brand clicks if content matches search intent. Luca Tagliaferro We don't just have consistent impressions. We have consistent impressions at more than 1,000 per day. For a 90-day-old domain, that's the sign of a content strategy that Google has decided is worth serving.
The slight dip from peak March impressions (some days hitting 2,000–2,900) into the 1,300–1,600 range of mid-April is worth noting but not concerning. The peak days in early April appear to have been specific posts gaining temporary traction before settling. The floor is what matters — and the floor is now firmly above 1,000 daily impressions, compared to below 300 in January.
Metric 2: Total Clicks — 218
Grade: B+
218 clicks over 90 days averages to about 2.4 clicks per day. That sounds modest — until you look at the daily distribution and see that the trend is sharply upward in the most recent weeks.
January 22 – February 14: 37 clicks across 24 days (1.5/day average)
February 15 – March 15: 51 clicks across 29 days (1.8/day average)
March 16 – April 20: 130 clicks across 36 days (3.6/day average)
That trajectory matters more than the total. Clicks in the last 36 days of the period are more than double the rate of the first 24 days. And the most recent daily data is even more encouraging — April 16 produced 8 clicks at an average position of 20.9. April 20 produced 7 clicks at position 18.3. Those are the two highest single-day click counts outside of the early February testing spike.
New domains face the longest timelines: 6 to 12 months before significant organic traffic, regardless of content quality. Search Scale AI 218 clicks in the first 90 days, with the daily rate more than doubling in the back half of the period, puts us ahead of the "no meaningful clicks expected yet" benchmark.
The blue line in the GSC chart is volatile because daily click counts on a new domain are inherently lumpy — a single post ranking briefly in position 5 on a given day produces a click spike that disappears when it settles back. What we're looking for is whether the floor is rising, not whether every day is better than the last. The floor is rising.
Metric 3: Average CTR — 0.2%
Grade: A (Correct for Position — With One Fascinating Asterisk)
A 0.2% aggregate CTR at an average position of 38 is mathematically expected and requires no corrective action at the portfolio level. Page 2 of Google results drops to 0.78% CTR, and the organic top 3 captures around 75% of all clicks. Incremys Position 38 is page 4. The expected CTR is a fraction of a percent.
But the daily data reveals something the aggregate obscures: when individual content hits high positions, the CTR is excellent.
February 9: position 15.9, CTR 1.9%
February 6: position 13.6, CTR 1.5%
February 5: position 24.1, CTR 1.4%
February 11: position 22.0, CTR 1.0%
February 26: position 20.4, CTR 0.6%
April 16: position 20.9, CTR 0.5%
April 20: position 18.3, CTR 0.4%
There is a clear pattern: on days when the average position is in the teens or low 20s, CTR climbs to 0.4%–1.9%. On days when average position is in the 30s–50s, CTR drops to 0%–0.2%. The content isn't failing to earn clicks — it's earning clicks at a rate that's appropriate or better than average for its position. The problem is that most of the time, most of the content is still too far back in the results.
This is actually great news. It means our titles and meta descriptions are working. When we rank, people click. The job is to rank higher, not to rewrite the snippets.
The number to watch in the next 90 days: As average position moves into the 20s consistently — which the April data suggests is beginning to happen — aggregate CTR should climb from 0.2% toward 0.4%–0.6%. When it does, that's the signal to start doing targeted snippet optimization on the highest-traffic posts.
Metric 4: Average Position — 38
Grade: A- (The Most Improved Metric)
The 38 aggregate average obscures what is arguably the most impressive trend in the entire dataset. Look at the daily position numbers chronologically:
Mid-March: 43–60 range (position 60.8 on March 14 — the worst single day of the period)
Late March: 37–54 range
Early April: 32–39 range
Mid-April: 20–25 range
Most recent days (April 15–20): 18–23 range
That is a 35+ point improvement in average position from the worst days in mid-March to the most recent days in mid-April. In roughly five weeks, average daily position moved from the 50s–60s to the high teens and low 20s. That's not noise. That's a domain crossing a trust threshold.
Keyword rankings begin to take shape within 2 to 3 months. True performance tends to stabilize by 6 months, and domain-level trust builds over a full year. M16marketing We are at month three — the exact moment "taking shape" is supposed to begin — and the daily data shows it happening in real time.
New websites often go through what SEO professionals refer to as the "sandbox effect," where Google holds back rankings while evaluating trust and credibility. This probation period can last anywhere from 6 to 12 months for new domains. Double Dot The March-to-April position improvement suggests we may be emerging from the sandbox faster than the standard 6–12 month estimate — likely because of the depth, consistency, and topic specificity of the content produced.
The milestone hiding in the most recent data: April 20 posted an average position of 18.3 — meaning on that day, our content was averaging just outside page 1 of Google. That's a single data point, not a stable trend yet. But 90 days ago, we averaged position 38 on a day where only 2 impressions existed. Today, we averaged position 18 on a day with 1,588 impressions. That's the whole story.
The Weirdest Data Points — and What They Mean
Two anomalies in the daily data deserve mention because they're interesting, not because they're problems.
January 29: 1,465 impressions at position 28.8. This is an outlier — nearly 10x the impressions of surrounding days in late January. A single piece of content briefly gained significant visibility, drove a spike in impressions, and then settled. This is a normal "Google test" phenomenon and likely represents an early post that earned brief elevated ranking before the domain's limited authority pulled it back.
March 3: Position 23.5, then March 4: Position 49.1. A 25-point position swing between consecutive days is jarring. What likely happened: on March 3, a smaller set of high-ranking queries dominated the impression mix. On March 4, the massive expansion of served queries (many of which rank lower) diluted the average. This is what the transition from a small, tight query footprint to a broad one looks like. It looks like a setback in the position metric but is actually a sign of growth.
The Overall Report Card
MetricValueGradeVerdictTotal Impressions101KA4x growth from Feb to March. Floor now above 1,000/day.Total Clicks218B+Daily rate more than doubled in back half of period.Average CTR0.2%ACorrect for position. CTR is strong when position is strong.Average Position38A-Daily position improved 35+ points from mid-March to mid-April.
Overall A -Ahead of new domain benchmarks. Sandbox exit beginning. Next 90 days are the growth phase.
What the Next 90 Days (April 22 – July 22) Need to Look Like
The data tells us exactly what to prioritize. We are not in the foundation phase anymore. We are entering the traction phase.
The position target: Average daily position should move from the current 18–23 range into the 12–18 range by July 22. That's page 1–2 territory for a broad query mix. Getting there requires continued publishing, internal linking, and the first meaningful backlink acquisition.
The click target: Daily clicks should move from the current 3–8 range toward 15–25 by July 22. That's achievable if average position continues its current improvement trajectory — at position 15, our demonstrated CTR is in the 1.5%–1.9% range. On 1,500 daily impressions, that's 22–28 clicks per day.
The impression target: Impressions should continue to grow as new content indexes and existing content earns broader query coverage. A target of 150,000 impressions in the next 90 days (days 90–180) is realistic based on current trajectory.
The three tactical priorities:
First, internal linking. We now have enough content that every new post should link to three or more existing posts, and the highest-impression existing posts should be updated to link forward to newer relevant content. This distributes authority across the domain and accelerates ranking for posts that are close to page 1.
Second, backlinks. New content with no links tends to take longer to rank unless the site already has strong domain authority. Search Scale AI The content we've produced is genuinely link-worthy — detailed, well-sourced, original analysis. Guest posts, industry directory submissions, and direct outreach to relevant publications are the highest-priority next step.
Third, targeted title and meta description optimization on the posts approaching positions 10–20. The daily CTR data proves our snippets perform well when we rank. A post sitting at position 14 with a mediocre title tag is leaving clicks on the table. Identify the five posts closest to page 1 and optimize their snippets for click-through.
The Bottom Line
Day 1: 2 impressions. Zero clicks. Position 33.
Day 90: 1,588 impressions. 7 clicks. Position 18.3.
That's the whole report card in two lines. A domain that started with literally nothing is now generating over 1,500 impressions daily, clicking at nearly half a percent on days when position is strong, and averaging page 2 positions in its most recent daily data.
While quick wins can occasionally appear within the first 90 days, it generally takes 3 to 6 months to see a consistent uptick in organic leads. SEO.com We are at day 90. The quick wins appeared. The consistent uptick is beginning. The next 90 days — April 22 to July 22 — are when this turns from promising to producing.
Frequently Asked Questions
What is a good average position for a new domain at 90 days?
Anything under 50 on a brand new domain at 90 days is a reasonable result, and anything trending below 40 with consistent downward movement is genuinely strong. The benchmark that matters more than the absolute number is the direction — a domain moving from position 55 to position 38 over 90 days is healthier than one sitting stable at position 25 that hasn't moved in weeks. By Google's own guidance, new websites take 4 months to a year before SEO efforts produce significant results, which means the first 90 days are about establishing a trajectory, not achieving a destination. Our average position of 38 at day 90, with the most recent daily data showing positions in the 18–23 range, puts us ahead of that curve.
Why did our average position get worse before it got better?
This is one of the most counterintuitive things that happens to new domains, and our daily data shows it clearly. Average position appeared to worsen significantly from mid-February into mid-March, hitting as low as 60.8 on March 14, before beginning a dramatic recovery. The explanation is that this is what a domain's query footprint expanding looks like from the inside. When a new domain first gets indexed, it typically ranks for a small number of queries, many of which are relatively specific and long-tail — and those rank reasonably well. As Google indexes more content and begins serving it for a broader range of queries, many of those new queries rank lower, pulling the average position down even though the domain is actually growing in visibility. The March impression explosion — impressions jumping from under 700 per day to over 1,700 per day almost overnight — is what caused the temporary position deterioration. It's growth that looks like regression until you understand what's happening.
What does a 0.2% average CTR actually mean for a new domain?
On its own, a 0.2% aggregate CTR tells you almost nothing useful about whether your content is performing well. What it tells you is that your average ranking position is deep enough in the results that most searchers never scroll far enough to see your content, let alone click it. At position 38, a 0.2% CTR is mathematically expected — it's not a title tag problem or a meta description failure. The more meaningful CTR signal for a new domain is the per-day CTR on days when position is strong. Our daily data shows CTR climbing to 0.4%–1.9% on days when average position is in the teens and low 20s, which confirms the snippets are working. Aggregate CTR becomes a meaningful optimization target once average position consistently reaches the 10–20 range, which is when the relationship between snippet quality and click behavior becomes the variable worth testing.
How many impressions should a new domain have after 90 days?
There is no universal benchmark because impressions depend heavily on how much content has been published, what topics it covers, and how competitive those topics are. A new domain with 5 blog posts will have dramatically fewer impressions than one with 30 well-optimized pieces covering high-search-volume topics. What we can say is that 101,000 impressions across 90 days, with daily impressions growing from 2 on day one to 1,500+ by day 90, represents strong content indexation and topic coverage for a blog that started from zero. The more important benchmark than the total is the daily floor — our impressions never fell below 1,000 per day after the March inflection point, which means Google is consistently serving our content to searchers across a broad and growing range of queries.
What caused the February 6–11 CTR and position spike?
The daily data shows an unusual cluster in the first two weeks of February where CTR hit 1.5%–1.9% and average position dropped to 13–15 — the best performance numbers of the entire 90-day period. What almost certainly happened is that Google temporarily elevated one or more pieces of content to first-page positions as part of its normal testing behavior for new domains. Google regularly tests new content in elevated positions to observe how users respond — if users click, engage, and don't immediately bounce back to the search results, that's a positive signal that can lead to more stable high rankings. If users don't respond as well, the content gets pulled back. In our case, the content earned elevated positions briefly, generated strong CTR during that window, and then settled back into lower positions while Google continued evaluating. The fact that our position has been improving steadily ever since suggests those tests sent positive signals.
Is 218 clicks in 90 days good for a new blog?
In absolute terms, 218 clicks is a modest number — it averages to about 2.4 clicks per day. In context, it's a legitimate result for a brand new domain. The more informative number is the trend: daily clicks in the last 36 days of our 90-day period ran at more than double the rate of the first 24 days. The most recent days in the dataset — April 15 through April 20 — produced 4, 8, 4, 3, 1, and 7 clicks respectively, with several of those days showing average positions in the 19–23 range. When average position reaches the mid-teens consistently, daily click counts of 15–30 become realistic on our current impression volume. The 218 total is where you start. The trajectory is what tells you where you're going.
Why does average position fluctuate so much day to day?
Daily average position in Google Search Console is an impression-weighted average across every query for which your content appeared that day. Because the mix of queries changes daily — sometimes a high-volume query drives lots of impressions from a page that ranks at position 45, other days a cluster of specific long-tail queries dominate impressions at much better positions — the average position can swing 10–20 points between consecutive days without anything meaningful changing about your rankings. This is why looking at trends over rolling 7-day or 28-day windows is more meaningful than comparing individual days. The 35+ point improvement in average position from mid-March to mid-April is a real trend. A single day swinging from 22 to 33 and back is normal statistical noise.
What are the most important things to do in days 90–180 to build on this foundation?
Three things matter most in the next 90 days. The first is internal linking — with enough content now published, every new post should deliberately link to three or more relevant existing posts, and high-impression existing posts should be updated to link to newer content. This distributes domain authority across the site and accelerates ranking for posts that are close to page one. The second is backlink acquisition — the content is link-worthy, but it needs external references from authoritative sites to accelerate domain trust. Guest posts, industry directory listings, and direct outreach to relevant publications are the highest-priority moves. The third is targeted snippet optimization on the five to ten posts closest to page one — our daily data confirms that when we rank in positions 15–22, our CTR is strong, meaning a post sitting at position 14 with an unoptimized title tag is genuinely leaving clicks on the table. Find those posts, sharpen the titles and meta descriptions, and capture the clicks that our rankings are already earning.