Cincinnati Local Search Statistics: What Tri-State Consumers Actually Do (2026 Edition)
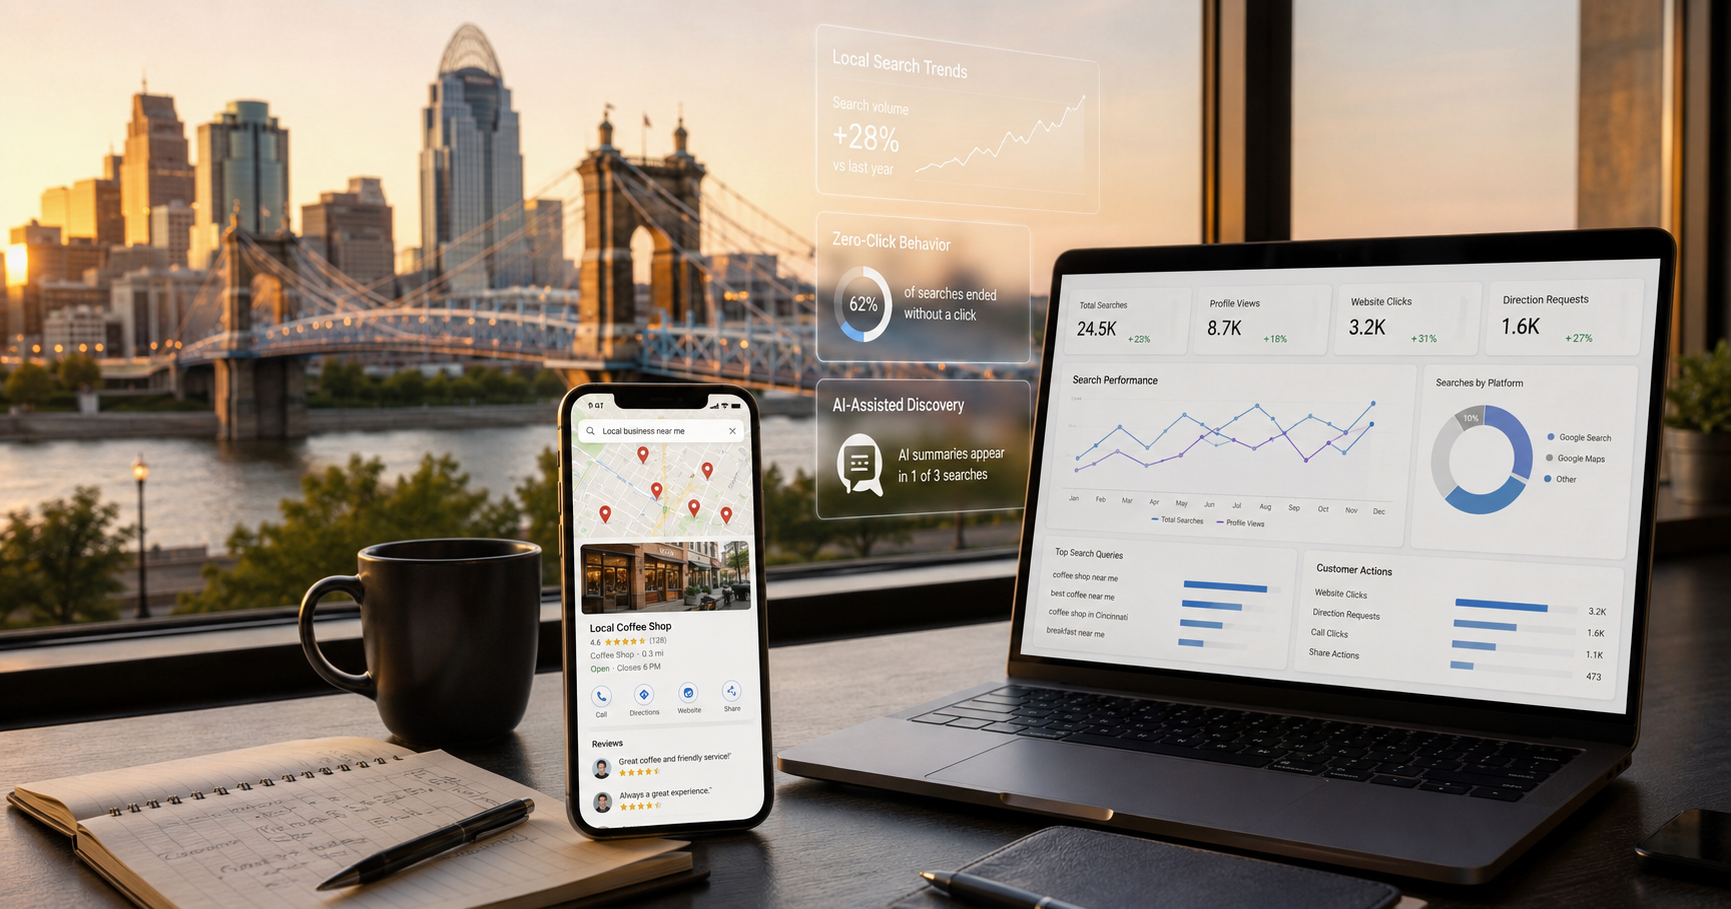
Every marketing pitch in Cincinnati leans on the same vague claim — "everyone searches online now" — and almost nobody shows the numbers. So we compiled them: 40+ statistics on how consumers actually find, judge, and choose local businesses, drawn from named national studies and applied to the tri-state market, with every source linked. Bookmark it, cite it, argue with it — and we'll update it as the data moves.
A note on method before the numbers, because publishing the fine print is the whole way we operate: most rigorous consumer-behavior research is national — nobody runs a 10,000-person panel just for Hamilton County. So what follows is the best available national data, from named studies with disclosed sources, organized around what it means for a business competing in this market. Where genuinely local figures exist, they're flagged as such. Where a stat's methodology is soft, we left it out; the internet has enough recycled zombie statistics without us feeding one more.
The market itself (the actually-local numbers)
The Cincinnati metropolitan area spans three states and roughly 2.2 million people — the largest metro in Ohio.
About half a million of those people live in Northern Kentucky, whose core counties have been part of the Cincinnati metro since the Census first drew it in 1950.
The metro fragments into dozens of distinct search markets — every suburb and neighborhood generates its own local results and map pack, because distance is one of Google's three explicit local ranking factors.
What it means here: "Cincinnati" is a label covering fifty separate contests, a third of them across a state line that consumers ignore and algorithms don't. Every statistic below plays out contest by contest.
How tri-state consumers find local businesses
97% of people learn about local businesses online — more than any other channel, including word of mouth.
Local intent drives an enormous share of search overall: studies place 46–57% of all Google searches as local.
"Near me" searches have grown more than 500% in recent years, with mobile "near me" queries still growing ~28% recently.
76% of local searches happen on smartphones — the kitchen table and the truck cab, not the desktop.
72% of consumers who did a local search visited a store within five miles.
What it means here: the front door of nearly every tri-state business is now a phone screen showing a map — and the five-mile radius stat is why the neighborhood-level game matters more than metro-wide visibility.
How fast they act (and how fast you have to)
88% of consumers who search for a local business on mobile call or visit within 24 hours.
Businesses that respond to inquiries within 5 minutes are 21x more likely to connect — and roughly 50% of leads choose whoever responds first.
What it means here: local search intent is same-day intent. The gap between a 5-minute callback and a 4-hour one isn't service quality — it's whether the lead existed at all.
The Google Business Profile layer
Complete profiles are about 70% more likely to attract location visits and 50% more likely to lead to purchasesthan incomplete ones.
Complete listings earn up to 7x more clicks than unfinished ones.
Marketers rank GBP signals as the heaviest single local-pack ranking factor, at ~32% of the algorithm.
Listings updated at least monthly perform ~32% better in engagement and conversions than stale ones.
Profiles with photos see ~42% more direction requests and ~35% more website clicks.
The average profile generates 59 actions per month — about 20 website clicks, 16 direction requests, and 10 calls — and 42% of GBP conversions happen without a website visit at all.
What it means here: for most tri-state service businesses, the free profile out-produces the website — and that last stat (42% convert without ever seeing your site) is the quiet headline of modern local marketing. The full playbook is here.
The review economy
Around 90% of consumers read online reviews before choosing a local business — with most filtering for 4 stars and up before comparing anything else.
Businesses that respond promptly to reviews see ~19% more click-throughs, and replying to all reviews lifts conversion by over 5%.
What it means here: in a market where everyone checks and most filter at four stars, reviews aren't reputation management — they're a ranking factor (Google says so directly) and a conversion gate, run best as a system: earn, answer, showcase.
The click collapse (why traffic ≠ what it used to)
Fewer than one-third of Google searches now result in a click to any website — roughly 68% end zero-click.
AI Overviews now appear on more than 20% of searches — and cut click-through rates by nearly 60% where they show.
The survivors are the cited: brands quoted inside AI answers earn 35% more organic clicks and 91% more paid clicks than uncited competitors on the same queries.
What it means here: a tri-state business can hold every ranking it's ever had and still watch clicks bleed — the fingerprint is impressions steady, clicks falling. The response isn't ranking harder; it's becoming what the new surfaces cite, which now multiplies paid performance too.
The AI shift (the numbers most local businesses haven't seen)
44% of U.S. adults have used ChatGPT, and 37% of consumers now begin searches with AI tools rather than a search engine.
43% of U.S. online shoppers used an AI assistant for product research in the past 90 days.
Among AI users, 46% now start purchase research on an AI platform — up from 25% in 2024 — while traditional search's share of starting points fell from 43% to 24%.
Vertical proof point: 30% of vehicle shoppers used AI during their buying journey — 68.4% of them on ChatGPT.
Recommendation queries lean on community and review platforms: Reddit appears in roughly 68% of AI responses containing "best" or "recommended", and brands present across major review sites see about a 3x citation multiplier in AI answers.
What it means here: a meaningful slice of tri-state buyers now gets recommendations from a channel that no local dashboard monitors — and when we tested it in this region, the pattern was hometown-strong, invisible one ring out. The only way to know your status is to prompt the engines.
Channel economics, quick hits
Search advertising in high-intent local verticals runs cheaper here than the coasts — automotive clicks average ~$2.41–$3.13 with cost per lead of $29–$52, against an all-industry CPL near $70 — but rented visibility resets to zero monthly.
Email remains the quiet workhorse at roughly $36 returned per $1 spent.
Organic Facebook reach for business pages has collapsed to about 2.2% of followers — down from ~16% a decade ago.
Well-run organic search programs post median returns around 748% — on the honest multi-quarter timeline, not overnight.
What it means here: the channels most tri-state businesses over-invest in (casual social, broad ads) are the ones the data has turned against, and the ones most neglect — the profile, the reviews, the owned content, the email list — are where the returns concentrate.
How to actually use these numbers
Statistics roundups mostly get skimmed and forgotten, so here's the operational version — four benchmark questions to run against your own business this week: (1) Does your Google Business Profile clear the completeness bar the 70%/7x stats reward, and has it been updated this month? (2) What's your real response time to a new lead, measured against the 5-minute/21x line? (3) Does your Search Console show the zero-click fingerprint — impressions steady, clicks falling — and if so, what do the AI engines say when you prompt them like a customer? (4) Is your review base growing monthly, above 4 stars, with responses? Four questions, thirty minutes, and you'll know which of these statistics is currently working for you and which is working for a competitor.
Frequently asked questions
What percentage of consumers search online before choosing a local business?
About 97% learn about local businesses online, with ~90% reading reviews before choosing and most filtering at 4 stars — making online presence effectively the front door for the entire tri-state market.
How fast do local searchers become customers?
Extremely: 88% of mobile local searchers call or visit within 24 hours, and half of leads go to whoever responds first. Local search intent is same-day intent — response speed is a ranking-independent lever most businesses leave unpulled.
Are these statistics specific to Cincinnati?
The market-size figures are; the behavioral data is national, from named studies, applied to the tri-state — disclosed up front because nobody runs rigorous panels for single metros, and recycled "local" stats without sources are how zombie numbers spread. Where behavior plausibly differs here (the state-line effects, the neighborhood fragmentation), we've tested it directly in this market rather than extrapolated.
What's the most important statistic on this page for a small business?
Pick two: 42% of Business Profile conversions happen without a website visit — the free listing now out-converts many websites — and 46% of AI users start purchase research on AI platforms, a channel no local dashboard monitors. Together they describe the shift: the decision increasingly happens before anyone reaches your site.
How often is this page updated?
We refresh it as the underlying studies update — sources and dates stay linked so you can check the vintage of every number yourself. If you spot a stronger or newer dataset for anything here, tell us and we'll evaluate it; keeping this page honest is the point of it.
The bottom line
Read together, the numbers describe one coherent shift: tri-state consumers find businesses on phones, judge them by profiles and reviews before ever visiting a website, act within a day, and — in fast-growing numbers — take recommendations from AI systems nobody's dashboard watches. The winners this data predicts aren't the biggest spenders; they're the businesses whose free surfaces are complete, whose reviews are systematized, whose response time is minutes, and whose presence extends into the answer engines while that ground is still cheap.
If you want these benchmarks run against your actual business — your profile, your review trend, your zero-click fingerprint, and what the AI engines say about your market — that's the free visibility check: every number above, made personal, in plain English.
Get your free visibility check →
Sources
WiserNotify: Google Business Profile statistics · Cube Creative: GBP stats and local search behavior · SQ Magazine: GMB statistics 2026 · Zipdo: GMB statistics · Content by Cass: 75 GBP stats · Search Endurance: GBP ranking-factor data
The Trust Agency: SEO results timeline statistics · Demand Local: Purchase intent signals
SparkToro: Zero-click search 2026 · Search Engine Land: Zero-click reaches 68% · ZipTie: Click behavior — cited vs. uncited
MarTech (L.E.K.): AI shopping stats 2026 · Instant Press (Pew): AI adoption statistics · Karooli (Accenture): AI and consumer behavior · Ekho: 2026 AI vehicle research study · Surfeo: Reddit in AI recommendations · 5W Research: AI citation source audit
PPC Chief: Google Ads cost benchmarks · Constant Contact (Litmus): Email ROI · Deep Marketing (Hootsuite): Organic reach 2026 · Sideways8 (SeoProfy): SEO ROI data
Wikipedia: Cincinnati metropolitan area · Google: Local ranking factors