How Long Will It Take a 4-Month-Old Domain to Catch a 21-Year-Old Company in Search? We Did the Math.
We've been publishing our own Google Search Console data publicly since we launched. Not because the numbers are impressive yet — they're not, not fully — but because we think the most useful thing an SEO and AI search agency can do is show you exactly what organic growth looks like in real time, including the gaps, the slow weeks, and the honest forecasts.
This post is about one of those gaps.
There is a company that has been in business since 2004. Twenty-one years of operation. A domain with two decades of history behind it. And right now, their organic search data tells a story that should make every established business owner uncomfortable — and every business considering SEO investment pay close attention.
We are going to compare their 90-day Google Search Console data against ours, identify exactly where they lead us, where we lead them, and — using real trajectory data — forecast when Ritner Digital is likely to close each gap.
This is not a victory lap. We are still behind them in several meaningful metrics. But the trajectory tells a very specific story about where both sites are headed, and the math behind it is worth understanding in detail.
The Two Sites: Side by Side Over 90 Days
Both datasets cover February 12 through May 11, 2026. Same 90-day window. Same search environment.
The 2004 Company — 90-Day Summary:
Approximately 670 total clicks over 90 days. Daily impressions ranging from 3,500 to 7,500, with an average of roughly 5,800–6,000 per day. Average position bouncing between 23 and 38, with a 90-day average around 31–32. A site that is clearly indexed, clearly visible, and generating real traffic — just not growing.
Ritner Digital — 90-Day Summary:
283 total clicks over the same 90 days. Daily impressions starting below 300 in mid-February and growing to 1,800–2,400 by May. Average position starting in the high 50s in early March and improving to the high teens by May. A site that started from essentially zero and has been compounding steadily every week.
The 2004 company currently leads us in total clicks, total impressions, and raw traffic volume. We currently lead them in average position — 18 versus their 32 — and in impression growth trajectory. Those two facts together tell you almost everything you need to know about where both sites are headed.
Where the 2004 Company Leads Us Right Now
Let's be precise about the gaps, because forecasting requires honesty about starting points.
Daily impressions: The 2004 company is generating approximately 5,000–6,000 impressions per day. Ritner Digital is generating approximately 1,800–2,400 per day. That's a gap of roughly 2.5–3x in their favor. In raw visibility terms — how many times each site appears in a Google search result — they are significantly ahead.
Total weekly clicks: Their recent 7-day total is 67 clicks (May 5–11). Ours is 43 clicks. They're generating roughly 55% more clicks per week than we are right now.
Total 90-day clicks: Approximately 670 for them versus 283 for us. They have generated more than twice as many total clicks over the same window.
Absolute content visibility: A site with 5,000–6,000 daily impressions has content indexed and ranking for a significantly wider range of search queries than a site generating 2,000. They have more pages ranking, more keywords covered, more surface area in search — all of which is the direct result of 21 years of accumulated content, even if that content hasn't been actively optimized.
These are real advantages. They are not insurmountable, but they are real, and pretending otherwise would be dishonest.
Where Ritner Digital Already Leads the 2004 Company
Now here's where it gets interesting.
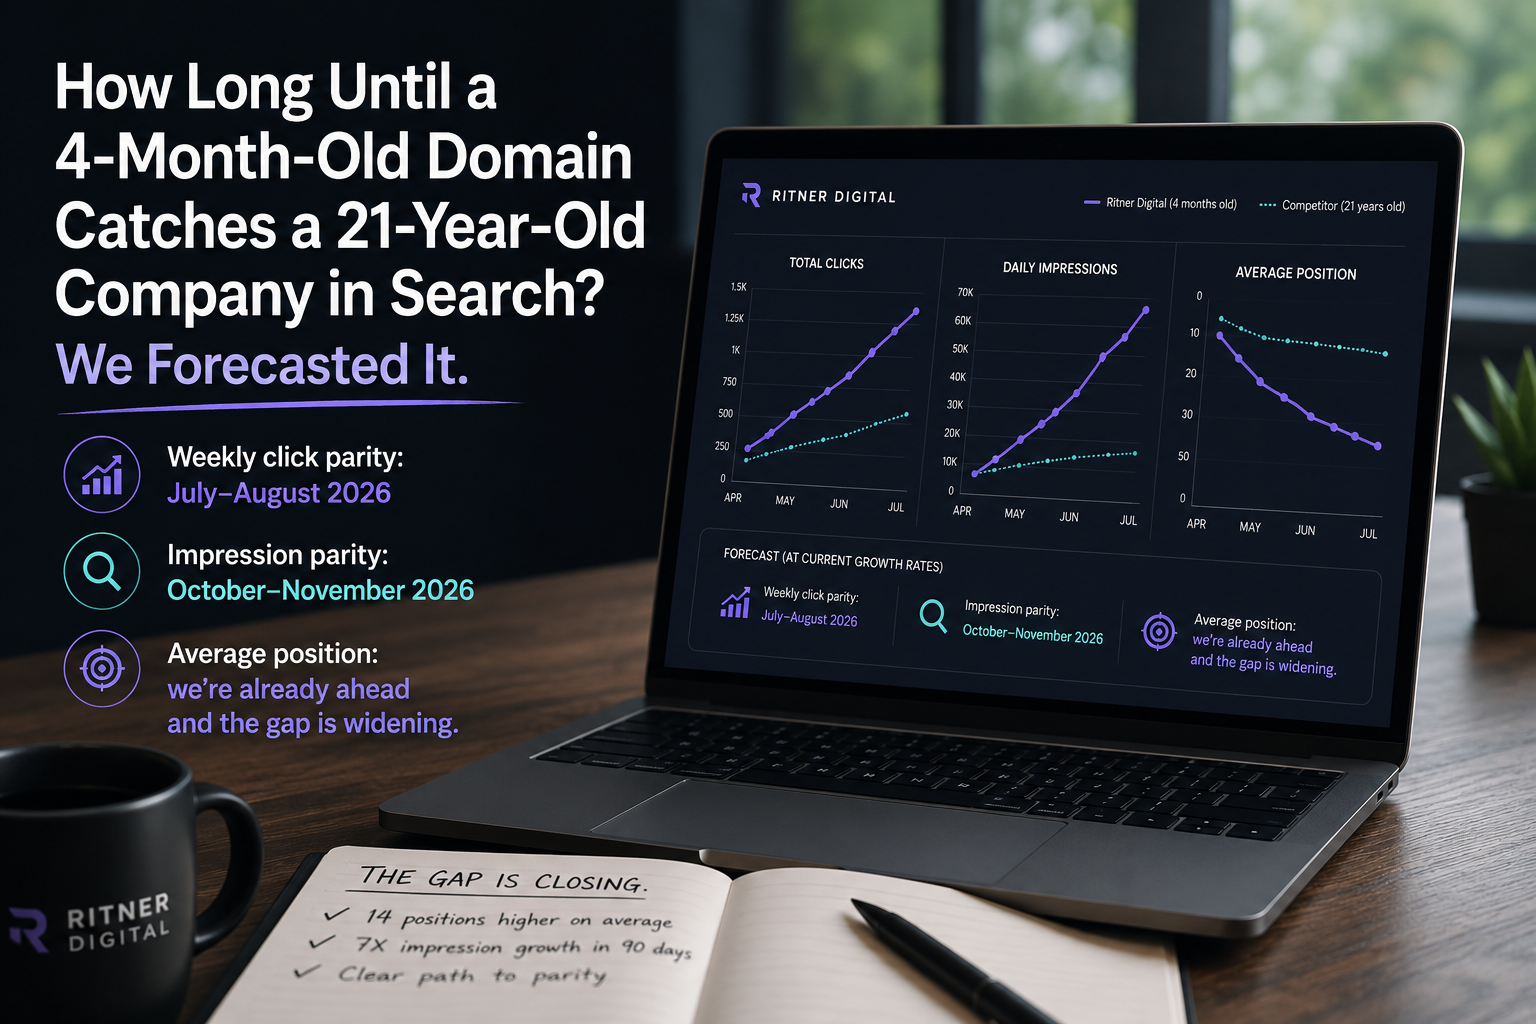
Average ranking position: Ritner Digital's current average position is approximately 18. The 2004 company's current average position is approximately 31–32. We are already ranking nearly 14 positions higher on average. That means when we appear in search results, we are appearing significantly closer to the top of the page — where click-through rates are dramatically higher.
Position trajectory: This is the most important comparison of all. Ritner Digital's average position has improved from the high 50s in early March to the high teens in May — a 35–40 position improvement in roughly 60 days. The 2004 company's average position over the same 90-day window has shown no meaningful improvement. They started around 27–30 in February and are sitting around 31–35 in May. If anything, their position has slightly worsened over the period.
Impression growth rate: Ritner Digital's daily impressions have grown from under 300 to over 2,000 in 90 days — roughly a 7–8x increase. The 2004 company's daily impressions have been essentially flat the entire window, ranging between 3,500 and 7,500 with no clear upward trend.
CTR efficiency at comparable positions: On days when Ritner Digital ranks in the 15–17 position range, our CTR runs 0.4–0.5%. The 2004 company, ranking in the 28–35 range, runs CTRs of 0.1–0.4% — lower rates on deeper positions. As our position continues to improve, our CTR will naturally increase alongside it, compounding the click volume growth.
In summary: they have more total visibility right now. We have better position, better trajectory, and a growth rate they cannot match with a flat content and SEO strategy.
The Forecast: When Does Ritner Digital Close Each Gap?
This is the part that requires real math, so let's be transparent about the methodology. We're using observed growth rates from our own 90-day data, assuming the 2004 company's metrics remain roughly flat (which the data supports), and projecting forward. These are estimates, not guarantees — SEO trajectories can accelerate or slow based on algorithm updates, content publishing pace, competition, and link acquisition. But they are grounded in real observed data, not assumptions.
Gap 1: Daily Impressions (Currently ~2,100 Ritner vs ~5,800 the 2004 company)
Ritner Digital's daily impressions grew from roughly 260 in mid-February to roughly 2,100 in mid-May — a growth of approximately 1,840 impressions per day over 90 days, or about 20 additional impressions per day on average. But the growth hasn't been linear — it has been accelerating. In February we gained roughly 5–8 impressions per day. By April we were gaining 15–25 impressions per day. By May the daily gains are running closer to 25–35.
If we model a continued acceleration — conservative estimate of 30 additional impressions per day on average through Q3 2026 — Ritner Digital reaches 5,000–6,000 daily impressions somewhere around October to November 2026. That is approximately 5–6 months from now.
If growth accelerates further as more content gets indexed and positions continue improving, that timeline could compress to August to September 2026 — roughly 3–4 months.
Forecast for impression parity: 3–6 months, most likely Q3–Q4 2026.
Gap 2: Weekly Clicks (Currently 43 Ritner vs 67 the 2004 company)
This gap is smaller than it looks, and it's closing faster than the impression gap because our position advantage already gives us a higher click yield per impression. At current trajectory — where our weekly clicks have grown from roughly 15–20 per week in February to 43 per week in May — we are adding approximately 3–4 net clicks per week to our weekly average each month.
The 2004 company's weekly click total has been relatively flat over the 90-day window, ranging between 50 and 90 clicks per week with no clear upward trend. Their average is approximately 67 per week.
At our current growth rate, Ritner Digital reaches 67 weekly clicks somewhere around July to August 2026 — approximately 2–3 months from now. This is the gap we will close first, and it is the most direct measure of organic traffic generation.
Forecast for weekly click parity: 2–3 months, most likely July–August 2026.
Gap 3: Average Position (Currently 18 Ritner vs 32 the 2004 company)
We already lead here, and this gap is widening in our favor. Our position has improved from the high 50s to the high teens in 90 days. The 2004 company's position has been flat to slightly declining. There is no scenario in the current data where the 2004 company closes this gap without a significant change in SEO strategy. We will continue to extend our position advantage as long as our content and optimization work continues at its current pace.
Current status: Ritner Digital already leads. Gap widening.
Gap 4: Total Accumulated Clicks (Currently 283 Ritner vs ~670 the 2004 company)
This is the longest gap to close because it's cumulative — we're not just catching up to their current rate, we're making up for a 90-day head start they had on us in this measurement window. In reality they have 21 years of accumulated traffic that we'll never "catch up to" in a historical sense. But in terms of current-period performance — what each site is generating month to month going forward — this gap closes when our monthly click rate exceeds theirs.
At current trajectory, Ritner Digital's monthly clicks will exceed the 2004 company's monthly clicks somewhere around August to September 2026. After that point, every month we will be generating more new organic traffic than they are, and the cumulative gap will begin closing in our favor.
Forecast for monthly click rate superiority: 3–4 months, most likely August–September 2026.
The Compound Effect: What the 2004 Company Would Need to Do to Respond
Here's the uncomfortable math for any established site watching a newer competitor close the gap: flat SEO performance is not neutral. It is effectively declining, because the competitive landscape does not stand still.
For the 2004 company to maintain their current lead over Ritner Digital past Q3 2026, they would need to meaningfully improve their average position from 32 toward 18–20, which requires active content development, technical SEO work, and link acquisition. They would need to grow their daily impressions, which requires new indexed content ranking for additional queries. And they would need to improve their CTR, which requires both position improvement and better-crafted meta titles and descriptions.
None of those things happen passively. All of them require investment.
If the 2004 company does nothing — maintains its current trajectory — our forecast is that Ritner Digital surpasses them in weekly clicks by July–August 2026, in daily impressions by October–November 2026, and begins compounding an increasing advantage in monthly traffic generation from that point forward.
If the 2004 company invests in SEO — begins actively publishing optimized content, improves technical performance, pursues link acquisition — they could extend their lead significantly. Their existing impression volume and domain history give them real structural advantages that could be activated quickly with the right strategy. A 21-year-old domain that suddenly starts optimizing seriously could see rapid position improvements. The foundation is there. It just hasn't been built on.
That is the scenario that should genuinely concern a newer competitor: not the established company that keeps doing nothing, but the established company that finally wakes up.
What the Position Gap Means in Dollars
Let's translate this into business terms, because position and impression numbers only matter insofar as they produce revenue.
The 2004 company currently averages approximately 67 clicks per week at an average position of 32. Ritner Digital currently averages approximately 43 clicks per week at an average position of 18.
Now consider what happens when Ritner Digital's impression volume reaches parity with the 2004 company — approximately 5,800 impressions per day — while maintaining our current superior position of 18. At a CTR consistent with position 18 (approximately 0.3–0.5%), 5,800 daily impressions would generate roughly 17–29 clicks per day, or 120–200 clicks per week.
The 2004 company, at position 32 with the same impression volume, generates approximately 9–11 clicks per day — 63–77 clicks per week.
Same visibility. Same market. But the site with the better position generates 2–3x the traffic. That's the position premium — and it compounds into leads, pipeline, and revenue in direct proportion.
At a 2–3% conversion rate, 120–200 weekly clicks produces 2–6 leads per week. The 2004 company at the same impression volume but worse position produces 1–2 leads per week. The gap in business outcomes from a 14-position difference is not linear. It is multiplicative.
The Honest Caveat: Forecasts Are Not Guarantees
We want to be direct about the limits of this analysis.
SEO trajectory forecasting is inherently uncertain. Google algorithm updates can move positions significantly in either direction — we have seen this in our own data, where certain weeks show sharp position fluctuations that don't reflect long-term trends. Content publishing pace matters enormously — if we slow down, our growth rate slows down. If the 2004 company accelerates, their numbers improve. Competition from other sites in the same space affects both of us.
The forecasts in this post — weekly click parity in 2–3 months, impression parity in 3–6 months — are based on observed growth rates extrapolated forward under the assumption that both sites continue on their current trajectories. They are the most informed estimates we can make from the available data. They are not certainties.
What we can say with confidence is that the directional story is clear: Ritner Digital's trajectory is upward and accelerating. The 2004 company's trajectory is flat. If those trajectories persist, the outcome is not in question — only the timeline.
What Every Business Should Take From This
Whether you're an established company watching a newer competitor close the gap, or a newer business wondering whether your SEO investment is on track, the data in this post illustrates a few principles worth internalizing.
Position beats volume in the long run. A site ranking at position 18 with 2,000 daily impressions is better positioned for long-term growth than a site ranking at position 32 with 6,000 daily impressions — because position improvement compounds into impression growth, which then compounds into click growth, which compounds into leads. Fix the position first. Volume follows.
Flat is not stable. The 2004 company is not declining dramatically. But flat impression growth and flat position improvement in an environment where competitors are compounding is functionally equivalent to losing ground. Stability in SEO metrics is not something to be comfortable with — it's a signal that the competitive gap is closing.
Trajectory is the most important number. Neither Ritner Digital's current 43 weekly clicks nor the 2004 company's 67 weekly clicks is the number that matters most. The number that matters is the rate of change. Our rate of change is strongly positive. Theirs is near zero. That divergence, sustained over time, produces the outcomes this forecast describes.
Time is the only resource you can't recover. Every month the 2004 company delays SEO investment is another month of compounding that Ritner Digital — and every other competitor actively investing in search — is doing instead. The gap that exists today was created by years of inaction. It can be closed, but it requires starting, and starting sooner is always better than starting later.
The Summary Forecast
We will update this forecast publicly as the data develops. That's the commitment we make when we publish our own numbers: you see the wins, the gaps, and the trajectory — all of it, in real time.
Is your business on the right side of a trajectory like this — or the wrong one? We can tell you exactly where you stand and what it would take to change the arc.
Talk to the Ritner Digital team → ritnerdigital.com
Sources:
Backlinko, "Google Click Through Rates (CTRs) by Ranking Position" — CTR distribution data by search result position used in click volume projections.
Ahrefs, "How Long Does SEO Take?" — research on organic traffic growth timelines and compounding trajectory patterns for new domains.
Google Search Central Documentation, "How Google Crawls and Indexes Content" — overview of how new content gets discovered, indexed, and ranked over time.
Advanced Web Ranking, "Organic CTR Study" — position-to-CTR conversion rates used in weekly click forecasting model.
Frequently Asked Questions
How did you calculate the forecast timelines for when Ritner Digital catches the 2004 company?
The forecasts are based on observed growth rates pulled directly from our own 90-day Google Search Console data. We measured how quickly our daily impressions, weekly clicks, and average position have been changing week over week, identified the acceleration trend in that growth, and extrapolated forward under the assumption that both sites continue on their current trajectories. The 2004 company's metrics have been essentially flat for the entire 90-day window, so their side of the projection is straightforward. Our side assumes continued content publishing, ongoing technical optimization, and no major algorithm disruptions. We've built in conservative and optimistic ranges to account for variability.
Is it realistic to close a 21-year domain age gap in a matter of months?
In terms of raw domain age as a ranking signal — yes, because domain age is a relatively minor factor in Google's algorithm compared to content relevance, technical quality, and authority signals. What you cannot close quickly is the gap in accumulated backlinks, brand search volume, or historical content depth if that content is well-optimized. What the 2004 company in this analysis has is largely unactivated potential — years of existence without the SEO investment to convert that history into ranking authority. That is a very different situation from competing against a 21-year-old domain that has been actively building search equity the entire time. Against an underinvested established site, a newer domain with a strong strategy can close the gap faster than most people expect.
Why is Ritner Digital already ranking higher than the 2004 company if they have more impressions and clicks?
This is one of the most important nuances in the data. The 2004 company has more impressions because they have more pages indexed and ranking across a wider range of queries — some of which may be tangential, branded, or low-competition terms that generate visibility without generating much traffic. Ritner Digital has fewer total impressions but ranks higher on average because our content is more precisely targeted to the queries we are pursuing. A smaller number of well-optimized pages ranking at position 18 will outperform a larger number of poorly optimized pages ranking at position 32 in terms of click yield per impression — which is exactly what the data shows. Quality of ranking beats quantity of indexed pages when the optimization gap is large enough.
What would the 2004 company need to do to prevent Ritner Digital from catching them?
The honest answer is that they would need to start investing in SEO seriously and immediately. Specifically that means auditing and updating their existing content for relevance and search intent alignment, publishing new optimized content consistently to expand their keyword coverage, addressing any technical SEO issues that may be suppressing their position, and beginning a structured link acquisition strategy to build domain authority. Their existing advantages — domain history, brand recognition, and accumulated content — give them a real foundation to build on quickly if they engage it. A 21-year-old domain that suddenly starts optimizing can see faster position improvements than a new domain because Google already has years of trust signals for the site. The window to act is open but it does not stay open indefinitely.
Could a Google algorithm update change these forecasts significantly?
Yes, and we want to be transparent about that. Algorithm updates are one of the primary sources of uncertainty in any SEO forecast. A core update could move positions significantly in either direction for both sites — either accelerating our trajectory or slowing it, and either disrupting the 2004 company's current rankings or improving them. What algorithm updates tend to do over time, however, is reward sites that are producing genuinely useful, well-structured, authoritative content — which is what both a strong SEO strategy and a strong GEO strategy are designed to produce. Sites that are building real content depth and authority tend to recover from algorithm disruptions faster and more completely than sites that are not. Our forecast assumes no major disruptive algorithm event, but the directional story — a compounding site outpacing a flat one — holds even through moderate volatility.
Why does the 2004 company have so many more impressions than Ritner Digital despite ranking worse on average?
Impression volume is primarily a function of how many queries your indexed pages appear for, which is largely determined by how much content you have covering how many topics. A 21-year-old site, even one that has underinvested in SEO, has likely accumulated hundreds or thousands of indexed pages over two decades — old blog posts, service pages, location pages, historical content — that collectively show up for a wide range of queries even at poor positions. Ritner Digital, launched in January 2026, has a fraction of that indexed content volume. The path to closing the impression gap is straightforward: publish more well-optimized content consistently so that more pages get indexed and ranked. Our impression growth rate — from under 300 to over 2,000 per day in 90 days — shows that this is already happening at a meaningful pace.
What happens to the forecast if Ritner Digital slows down its content publishing?
The timelines extend proportionally. SEO growth is directly tied to the pace at which new, optimized content gets indexed and begins ranking. If we publish less, fewer new pages enter the ranking pool, impression growth slows, and the position improvements on new terms slow alongside it. This is why consistency is one of the most important variables in any SEO growth forecast — it is not enough to publish well occasionally, the publishing cadence has to be sustained over time for the compounding effect to hold. Our forecast assumes we maintain roughly our current content pace. If we accelerate it, the timelines compress. If we slow down, they extend.
What does this comparison mean for a business owner evaluating whether to invest in SEO?
It means the cost of waiting is measurable and growing. The 2004 company's current position — being actively caught by a domain that is four months old — is the direct result of years of SEO underinvestment. That gap did not appear overnight and it will not be closed overnight, but the longer an established business waits to invest, the more compounding ground newer or more active competitors gain. For a business considering SEO investment for the first time, the most important insight from this data is not how long it takes to catch a competitor — it is how quickly the trajectory diverges between a site that is investing and a site that is not. Two sites at the same starting point, one investing in SEO and one not, will look dramatically different in 12 months. That divergence is what the data in this post shows in real time.
Want to know where your site's trajectory puts you relative to your competitors? We can pull the data and show you exactly where the gaps are.