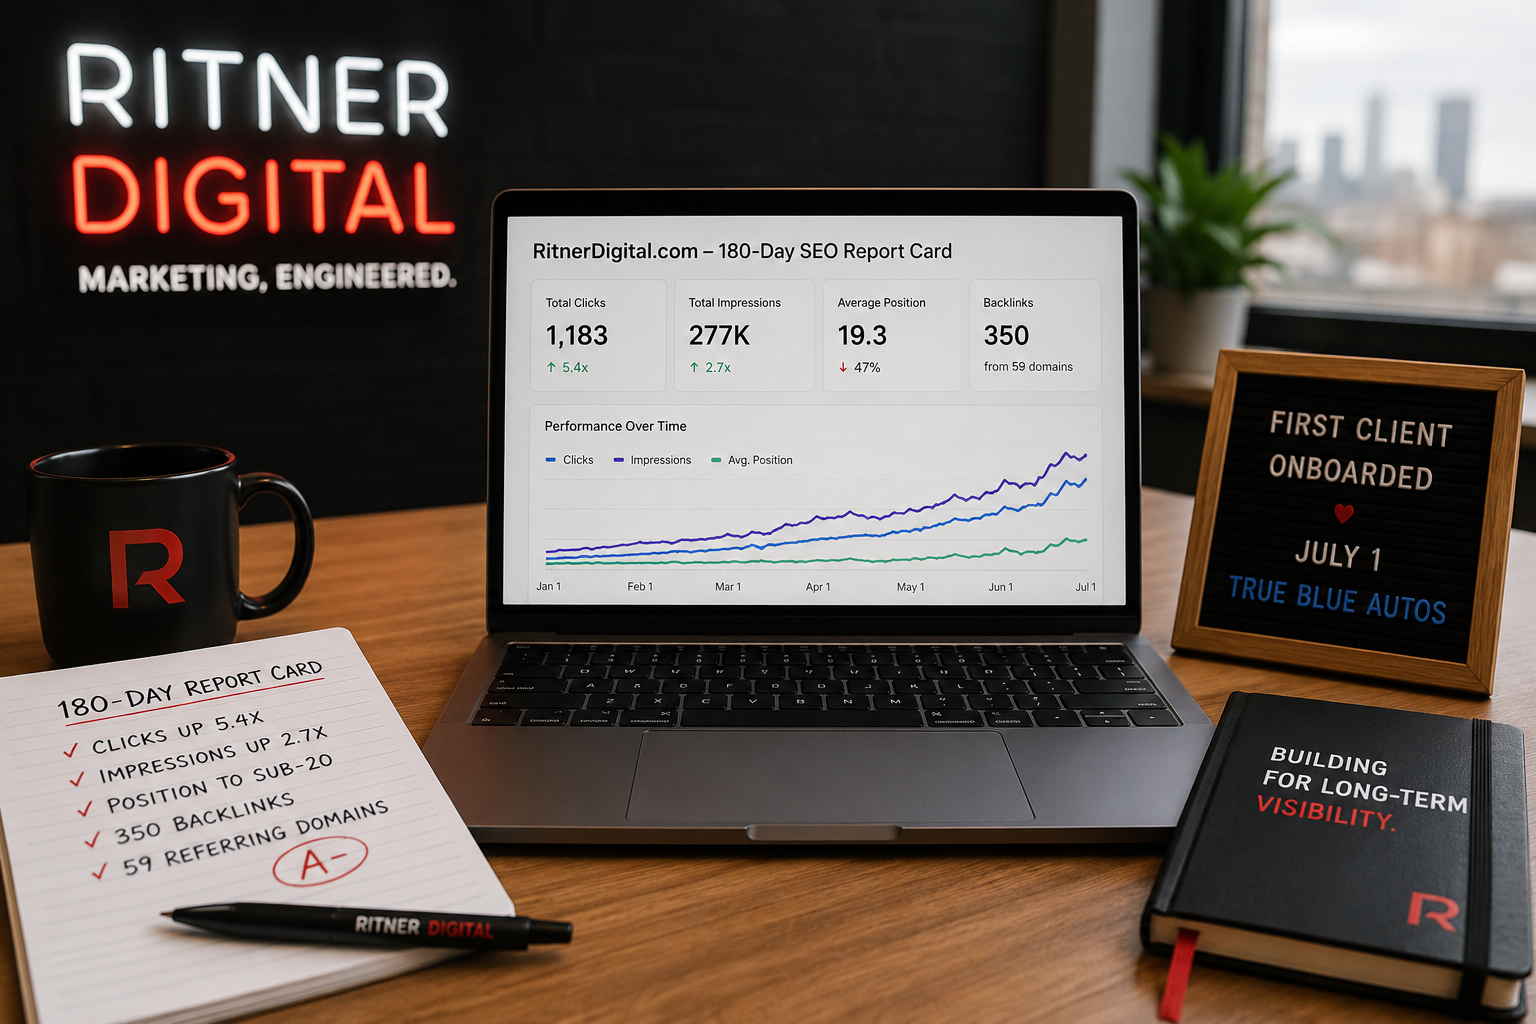
Today is exactly 180 days since Ritner Digital's blog went live on a brand new domain with zero history and zero authority. Just content, strategy, consistency — and, from early on, a deliberate link-building effort we ran on ourselves.
But before the data, the thing we're proudest of — and it isn't a number in Google Search Console.
On July 1st, 2026, we onboarded our very first client: True Blue Autos.
True Blue is a family-owned, family-run independent dealership in Greensburg, Indiana, specializing in quality pre-owned vehicles and commercial trucks and vans. If you read the reviews — and there are a lot of them — one word keeps coming up: honest. People drive hours to buy from Ted and his team because they're treated like family and never pressured. That's a business built the right way, and it's exactly the kind of client we started Ritner Digital to serve: real operators who earn their reputation and deserve to be found by the people already looking for them.
We're not going to share client performance data here — that's theirs, not ours, and this report card is specifically about grading our own domain. But we'll say this plainly: everything you're about to read below is the proof-of-work behind that first handshake. For six months we pointed our full SEO, GEO, and link-building methodology at our own site, in public, so that when we sat across from our first client we could show rather than tell. The 180 days of data in this report is the pitch. True Blue is the first business to say yes to it.
Here's to many more over the years.
Now — to the honest grade. Same rules as our 90-day report card: no spin, no cherry-picking, no vanity framing. Just a straight read of what 91 days of daily GSC data actually says about days 90 through 180.
The Four Numbers (April 21 – July 20)
Total Clicks: 1,183
Total Impressions: 276,747
Average CTR: 0.43%
Average Position: 19.8
Every one of those four moved in the right direction, and three of them moved a lot. Last quarter we earned 218 clicks. This quarter, 1,183 — but even that understates it, because the quarter was not evenly distributed. The story is in the daily and weekly data, and that story is an acceleration that is still going as of the last row in the export.
Before the Grades: What the Weekly Data Actually Shows
Last quarter we read the data day by day and found three chapters. This quarter, the daily numbers are noisier but the weekly rollup is astonishingly clean — it tells one continuous story in three movements.
Movement 1: A quiet, slightly frustrating May.
Through late April and early May, the domain kept doing what it had been doing — 1,400–2,200 impressions a day, positions in the mid-to-high teens, a handful of clicks. Then, in the two weeks spanning May 18–31, average position abruptly got worse: the week of May 18 averaged position 34.0, the week of May 25 averaged 34.5, roughly double the ~17 we'd been running. If you were watching the position line alone, you'd have panicked.
You shouldn't have. This is the exact same phenomenon we documented at the 90-day mark, one level up: impressions that week climbed even as position sank, because Google was again widening the net — serving our content for a much broader, more competitive set of queries, many of which ranked deep. Growth that looks like regression. We know how this movie ends now, because we've seen it before on this very domain.
Movement 2: The June breakout.
The week of June 1 posted 84 clicks — more than double any prior week of the quarter. The week of June 8, 121. June 15, 148. And as the clicks exploded, position reconverged downward: 27.7 → 19.1 → 17.8 → 16.0. This is the mirror image of May. The broad query footprint Google handed us in May started ranking, and the click curve went vertical.
June alone produced 557 clicks — more than 2.5× the entire previous 90-day period. Average daily clicks went from 5.7 in May to 18.6 in June.
Movement 3: A July that's holding the gains, not giving them back.
The worry after a spike is always the give-back. It didn't come. July (through the 20th) is running 20.1 clicks/day and an impression-weighted position of 16.1 — the best monthly position of the entire six months, at the highest click volume of the entire six months. July 8 set the single-day click record at 32 clicks on 4,576 impressions. The last row in the export, July 20, posted 30 clicks at position 15.8. The floor didn't just hold. It kept rising.
That is the whole quarter in one picture: clicks climbing, position falling, and the May "regression" revealed in hindsight as the launchpad for the June breakout.
Metric 1: Total Clicks — 1,183
Grade: A
Last quarter this was our weakest headline metric (B+, 218 clicks). This quarter it's the standout. 1,183 clicks is a 5.4× increase over the prior period, and unlike a lot of traffic charts, this one didn't peak and fade — it's near its high at the end of the window.
The monthly progression tells you everything:
April (21–30, partial): 47 clicks — 4.7/day
May: 177 clicks — 5.7/day
June: 557 clicks — 18.6/day
July (1–20): 402 clicks — 20.1/day
The rate more than tripled from May to June and then held into July. When a new domain's click rate triples in a month and doesn't regress the following month, that's not a lucky viral post — that's the compounding phase arriving. We predicted at day 90 that days 90–180 would move daily clicks "from the current 3–8 range toward 15–25 by July 22." We closed the window at 20/day. Target met.
The click distribution is also far healthier than last quarter. We now have 30 pages with 10+ clicks and 54 pages with 5+ clicks, versus a top table last quarter where a single blog post was the lone double-digit performer. Depth of catalog is doing the work now, not one or two lucky posts.
Metric 2: Total Impressions — 276,747
Grade: A
276,747 impressions in the quarter, against 101,000 in the prior 90 days — a 2.7× increase. More importantly, the daily floor rose again. Last quarter we were proud that impressions never fell below 1,000/day after the March inflection. This quarter the floor is roughly 3,000/day through June and July, with multiple days above 4,500. July 7 set the single-day impression record at 4,761.
Monthly average daily impressions:
April (partial): ~1,822/day
May: ~2,194/day
June: ~3,782/day
July: ~3,852/day
At the 90-day mark we set a target of 150,000 impressions for this window. We nearly doubled it. The June step-change (2,194 → 3,782 daily) is the same kind of query-footprint expansion we saw in March, but from a much higher base and — critically — this time the expansion converted, because the domain had enough accumulated trust for the newly-served queries to rank rather than languish on page 5.
Metric 3: Average CTR — 0.43%
Grade: A
A 0.43% aggregate CTR at an average position of 19.8 is exactly where it should be — and it's more than double last quarter's 0.2%. The reason is simple and it's the reason we predicted: CTR is a function of position, and position improved. Last quarter our content spent most of its time on pages 3–4, where almost nobody clicks. This quarter it lived on pages 2–3 with a real presence on page 1, and the clicks followed automatically.
The device split makes the point sharper than the aggregate:
Desktop: 786 clicks, 0.34% CTR, position 19.6 — 83% of impressions
Mobile: 387 clicks, 0.84% CTR, position 19.9 — 16.6% of impressions
Tablet: 10 clicks, 0.75% CTR, position 37.1
Mobile is again the quiet overachiever: at essentially the same average position as desktop, it converts at 2.5× the rate.Mobile's share of clicks (32.7%) is roughly double its share of impressions (16.6%). We flagged this at day 90 as an opportunity; it's still an opportunity, and it's still under-exploited. Every position gain we make on mobile is worth 2.5× a desktop gain in click terms.
The individual-page CTR data confirms the snippets are doing their job. When a page ranks, it earns clicks at a strong rate: the "did Claude get worse at writing" post pulls 1.85% CTR at position 7, the home-parties post 4.14% at position 9.2, the "did Claude get meaner" post 4.57% at position 7. These aren't position-3 CTRs bailed out by luck — they're page-1 rankings converting exactly as they should. Titles and metas are not the bottleneck. They never were.
Metric 4: Average Position — 19.8
Grade: A
Last quarter's aggregate was 38 (graded A−, "most improved"). This quarter's is 19.8 — the domain's entire average footprint moved from the bottom of page 4 to the bottom of page 2, and the most recent weeks are markedly better than the average implies.
The impression-weighted weekly position for the final five weeks: 16.0 → 14.8 → 16.1 → 17.3 → 15.8. The domain is now, on a broad and competitive query mix, averaging mid-page-2, brushing page 1. The single best day of the quarter for position was April 30 at 13.7; the July record-click days sat at 15.2–15.5. Our day-90 target was to move average daily position "into the 12–18 range by July 22." We're there, on the weeks that count.
The May "regression" is worth dwelling on one more time because it's the most instructive data point in the set. Position 34 for two weeks in May felt bad in the moment. In hindsight it was the necessary cost of the June breakout — Google can't expand your query footprint without temporarily tanking your average, and it can't hand you a breakout month without first expanding your footprint. If you kill your content strategy during a May, you never get a June.
Where the Clicks Came From: The Content That Broke Through
Last quarter, our top performers were service-adjacent posts and a couple of local pieces. This quarter, a clear editorial identity emerged — and it's not the one you'd expect from an SEO agency.
The single biggest post of the quarter, by a wide margin, is "Did Claude Get Worse at Writing? What the Data Actually Says in June 2026" — 113 clicks, 6,101 impressions, 1.85% CTR, position 7.06. The AI-model-behavior beatas a whole (the two "Claude" posts plus the image-generator explainer) drove over 160 clicks. These are timely, data-driven posts about how AI tools actually behave — and they're punching far above anything in the pricing/services catalog.
The "brands born in [state]" series is a second reliable engine (Utah at 27 clicks/position 6.5, New Jersey, and others). The cultural-SEO one-offs — the viral German tourist "Freddy" post (41 clicks), the home-parties/direct-sales deep dive (60 clicks, 4.14% CTR) — show that a strong hook plus real analysis outperforms keyword-targeted service pages on this domain right now.
The query data underlines the same theme. The top click-driving query is "american society for ai" (13 clicks, 6.74% CTR, position 5.4) — a branded-adjacent term we own almost by accident. The rest of the click-earning queries are long-tail and topical: "sitemap in footer," "german tourist freddy," "claude pushback," "discerning consumer." We are winning specific, interesting questions — not yet the fat commercial heads.
Which brings us to the thing that still isn't working — and the metric behind it that most people misread.
What's Still Not Working: The Commercial Head Terms — and the Authority Behind Them
Here's the honest part. The posts winning clicks are editorial. The pages that would actually generate leads — the pricing and service pages — are still stuck, exactly as they were at day 90, and in some cases the gap is stark:
"ai seo agency" — 1,810 impressions, 0 clicks, position 77
"ai search agency" — 1,329 impressions, 0 clicks, position 24
"marketing podcasts" — 1,359 impressions, 0 clicks, position 41.5
/geo service page — 859 impressions, 0 clicks, position 81
/blog/how-much-does-ai-search-optimization-cost — 720 impressions, 0 clicks, position 43.5
/platform-comparisons/shopify-vs-wordpress — 1,303 impressions, 0 clicks, position 47
There's one tantalizing exception that shows the ceiling is liftable: "how can i find an ai seo provider in the united states…" sits at position 3.3 on 2,712 impressions — but still 0 clicks, because it's an AI Overview / conversational query where the click often never happens. That's the GEO paradox in miniature: we're winning the visibility and the answer box is eating the click.
Now, the part we want to be precise about, because we said something adjacent to this at day 90 and the framing deserves sharpening. The problem is not that we have no backlinks. We do — and we've built them deliberately from day one. As of July, Semrush shows 350 backlinks from 59 referring domains, up +17% and +48% respectively over the trailing period, climbing steadily from essentially zero a year ago. The profile is healthy on the dimensions that matter for durability: 87% follow / 13% nofollow (a natural ratio), and 99% editorial text links rather than spammy footprint links. This is not a domain scraping by on content alone.
What's still low is Authority Score, which sits at 7. And that's the actual bottleneck — not the existence of links, but the authority those links accumulate over time. Authority Score is a lagging indicator. You build links this month; the trust they confer compounds over many months. Ours hasn't caught up to our link velocity yet, and most of our 59 referring domains currently sit in the lower authority bands (roughly two-thirds score 0–10), which is exactly what you'd expect for a domain this young. That's the honest read: the links are coming in fast; the domain authority they build is the slower part, and the commercial head terms are decided by that authority. "ai seo agency" and the pricing pages are contests everyone with an established, high-authority domain is also fighting — and on authority, specifically, we're still early.
So the day-180 diagnosis isn't "go get backlinks." It's "keep the link velocity high, raise the quality of the referring domains, and let authority compound." More on that below.
Geographically, the footprint kept globalizing. 75 countries produced clicks this quarter (up from 36). The US leads with 571 clicks (165K impressions), the UK with 118. But the international quality is notable: Australia (53 clicks, position 16), India (48, position 15), Germany (42 clicks at position 10.4, 0.64% CTR), Netherlands (position 9.3). Several non-US markets rank better than the US average — a sign the content travels and isn't purely locally anchored.
The Overall Report Card
Four metrics, four grades, and this quarter there's no A− hedging. Clicks up 5.4×, impressions up 2.7×, CTR doubled, position nearly halved — with the strongest numbers landing in the final weeks rather than the middle. The one honest deduction is strategic, not statistical: the money pages still aren't moving, and the lever is domain authority — not a lack of backlinks, but the trust those backlinks accumulate slowly over time.
Overall grade: A. Last quarter we were "ahead of new-domain benchmarks." This quarter we're producing — a domain averaging page 2, brushing page 1, on 3,000+ impressions a day, with a 350-link profile built from scratch, six months from a standing start of two impressions.
Here's the arc, restated honestly:
Phase 1 (Jan 22 – Apr 22) — Foundation. Complete. 916 pages indexed, sandbox entry and partial exit, link-building underway. Grade: A−
Phase 2 (Apr 22 – Jul 22) — Traction. Complete. Clicks 5.4×, position to sub-20, June breakout held through July, backlink profile up to 350 from 59 domains. Grade: A
Phase 3 (Jul 22 – Jan 22, 2027) — Compounding. Now. The single job: raise domain authority so the editorial trust converts into commercial-page rankings. That means higher-authority links, not just more of them.
What the Next 90 Days (July 22 – October 22) Need to Look Like
We are past traction. The content engine works, and the link engine is running. The remaining problem is narrow and specific, which is a good problem to have.
The one thing that matters most: authority, which means link quality now, not just quantity. We've proven we can earn links — 350 from 59 domains in six months is a strong base. The next move is to land referring domains in the higher authority bands (the 40s, 50s, and up), because those are what actually move Authority Score, and Authority Score is what the commercial head terms are decided on. The editorial catalog — especially the AI-behavior posts already earning links organically — is the raw material for digital-PR outreach that targets authoritative publications rather than volume for its own sake.
The click target: sustain 20+/day and push toward 30–35/day by October 22. On current impression volume (~3,800/day) and demonstrated page-1 CTR (0.8–1.9%), that's arithmetic, not hope — it requires moving a handful of the high-impression commercial pages from page 4–5 onto page 2.
The position target: hold the aggregate under 20 and get the pricing/service cluster (/geo, AI-SEO-cost, the pricing pages) from the 40s–80s into the 20s. That's an authority-and-internal-linking job, not a content job.
The GEO question we have to answer: that position-3.3 query with zero clicks is the future arriving early. As AI Overviews eat more clicks, "ranking" and "getting traffic" keep decoupling. Next quarter we should start reporting a citation/visibility metric alongside clicks, because for a chunk of our best-ranking commercial queries, the click is never coming — and we should be measuring the thing that replaces it.
The Bottom Line
Day 90: 1,588 impressions. 7 clicks. Position 18.3.
Day 180: 3,933 impressions. 30 clicks. Position 15.8.
That's the quarter in two lines. Clicks per day roughly quadrupled, impressions more than doubled, and position — already good — got better. The editorial engine is firing on its own, and the backlink profile grew to 350 links from 59 domains. The work ahead isn't acquiring links from scratch — it's raising the authority those links compound into, so the commercial pages finally break through. That's the assignment for days 180–270.
But the number that actually mattered most this quarter was 1 — our first client, True Blue Autos, onboarded July 1st. We spent 180 days proving the method on ourselves so we'd have something real to stand behind. Now the work begins for someone else, too. And that's the whole point.
Frequently Asked Questions
What is a good average position for a new domain at 6 months?
There's no single benchmark, but the direction matters more than the absolute number. A domain that moves from the 30s–40s at 90 days into the teens–low 20s by 180 days is on a healthy trajectory, because it means Google isn't only serving your content but ranking it competitively across a broadening set of queries. Our impression-weighted average position for days 90–180 was 19.8 — roughly the bottom of page 2 — and the final five weeks averaged 16.0, 14.8, 16.1, 17.3, and 15.8, meaning the most recent data is materially better than the quarter's average. By Google's own guidance, new sites typically take four months to a year before SEO produces significant results, so reaching sub-20 on a broad, competitive query mix at exactly six months puts a domain ahead of that curve.
Why did our average position get worse in May before the June breakout?
This is the single most instructive pattern in the dataset, and it's the same phenomenon we documented at 90 days, one level up. For two weeks in mid-to-late May, our impression-weighted position abruptly worsened to roughly 34 — about double the ~17 we'd been running — and watching the position line alone, it looked like a setback. It wasn't. Impressions climbed that same fortnight, because Google was widening the net and serving our content for a much broader, more competitive set of queries, many of which ranked deep at first. That's a footprint expansion, and it always drags the average down temporarily. The payoff arrived in June: those newly-served queries started ranking, clicks more than doubled week over week, and position reconverged into the mid-teens. A domain can't get a breakout month without first expanding its footprint, and it can't expand its footprint without a temporary hit to average position. If you panic and cut your content strategy during a May, you never get a June.
How did clicks grow so much between the 90-day and 180-day marks?
The prior 90 days produced 218 clicks; days 90–180 produced 1,183 — a 5.4× increase. The more important detail is that the growth wasn't front-loaded and it didn't fade. The monthly progression ran from about 4.7 clicks per day in late April, to 5.7 in May, to 18.6 in June, to 20.1 across the first twenty days of July. The rate more than tripled from May to June and then held into July rather than regressing, which is the signature of the compounding phase arriving rather than a single lucky viral post. The click distribution also broadened: we now have 30 pages earning 10 or more clicks, versus a prior quarter where a single blog post was the lone double-digit performer.
Why is CTR still under half a percent if the content is ranking better?
Aggregate CTR is almost entirely a function of average position, and at an average of 19.8 — the bottom of page 2 — a 0.43% click-through rate is exactly what you'd expect. It's more than double the 0.2% we posted at 90 days, and the improvement came from better rankings, not rewritten snippets. The proof is in the per-page data: when a post reaches page 1, it converts strongly, with several of our top posts pulling CTRs between 1.8% and 4.6% at positions 7 to 9. The titles and meta descriptions are already doing their job; the ceiling on aggregate CTR is position, not copy. As more pages move onto page 1, aggregate CTR should keep climbing without any snippet changes.
What kind of content drove the most traffic?
The clear winner this quarter was our AI-model-behavior beat — timely, data-driven posts about how AI writing tools actually perform. Our single biggest post analyzed whether one popular model got worse at writing, earning 113 clicks at position 7. That beat, plus a recurring "biggest brands born in [state]" series and cultural-SEO one-offs like a viral-tourist explainer and a deep dive on the direct-sales party model, outperformed every keyword-targeted service and pricing page on the domain. The pattern is consistent: on a young domain still building authority, a strong hook paired with genuine original analysis ranks faster than commercially-optimized pages, because those editorial pieces can win on content quality and freshness while competitive money terms are decided by domain authority that takes longer to accumulate — even with a growing backlink profile behind it.
Do you have backlinks, and how many?
Yes — and we've built them deliberately from day one. As of July, Semrush shows 350 backlinks from 59 referring domains, up 17% and 48% respectively over the trailing period, climbing steadily from essentially zero a year ago. The profile is healthy on the dimensions that matter for durability: an 87% follow / 13% nofollow ratio, which is natural rather than manipulated, and 99% editorial text links rather than spammy footprint links. So the domain is not scraping by on content alone. What's still low is Authority Score, currently 7 — and that distinction is the whole point of the next question.
If you have 350 backlinks, why are the commercial pages still stuck?
Because the bottleneck isn't the existence of links — it's the authority those links accumulate over time. Authority Score is a lagging indicator: you build links this month, but the trust they confer compounds over many months. Ours hasn't caught up to our link velocity yet, and most of our 59 referring domains currently sit in the lower authority bands (roughly two-thirds score 0–10), which is exactly what you'd expect for a domain this young. Commercial head terms like "ai seo agency" and the pricing pages are contests every established, high-authority domain is also fighting, and they're decided on authority specifically — where we're still early. Editorial posts can rank on quality; money terms wait for authority to compound. The links are coming in fast; the domain authority they build is the slower part.
What does it mean that a query ranks in position 3 but still gets zero clicks?
It's a preview of where search is heading. One of our queries about finding an AI SEO provider sits at roughly position 3 on more than 2,700 impressions, yet earned no clicks in the period — because it's a conversational, AI-Overview-style query where the answer often appears directly in the results and the user never clicks through. This is the core tension of generative engine optimization: ranking and receiving traffic are decoupling. As AI Overviews absorb more queries, being cited in the answer becomes as important as being clicked, and traditional click metrics understate real visibility. That's why we plan to start reporting a citation and AI-visibility measure alongside clicks next quarter — for a growing share of our best-ranking commercial queries, the click may never come, and we should be measuring the thing that replaces it.
What are the priorities for the next 90 days?
Three things, in order. First and most important: authority, which means raising the quality of our backlinks, not just the quantity. We're not starting from scratch — 350 links from 59 domains in six months is a strong base — but most of those referring domains sit in the lower authority bands, so the next move is landing higher-authority links through digital-PR outreach on the AI-behavior content that's already earning references organically. That's what actually lifts Authority Score, and Authority Score is what unlocks the stalled commercial pages. Second: continued internal linking, so every new post reinforces the pages sitting just off page 1. Third: begin measuring AI-Overview citations and visibility, not just clicks, because a meaningful slice of our commercial rankings now live in answer boxes rather than blue links. The click target is to sustain 20-plus per day and push toward 30–35; the position target is to hold the aggregate under 20 while dragging the pricing and service cluster out of the 40s–80s and into the 20s.