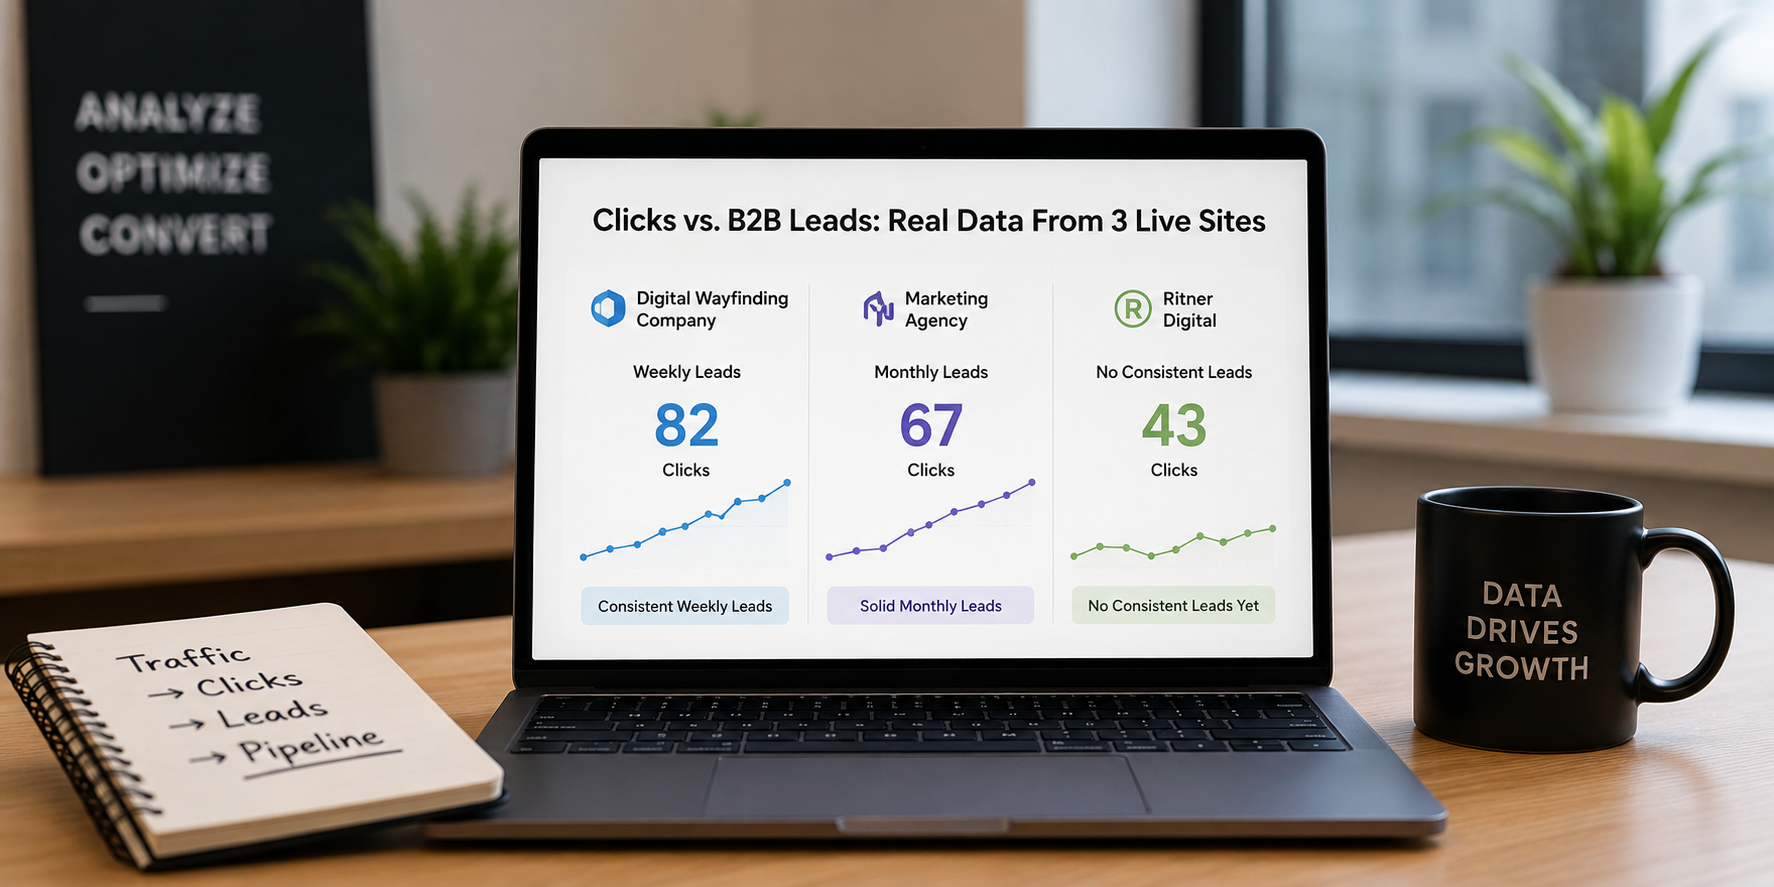
How Many Clicks Does It Actually Take to Generate Leads? Real Data From Three Live Sites — Including Our Own
There's a question every business owner asks sooner or later when they're investing in SEO: "When am I actually going to start seeing leads?"
It's a fair question. And the honest answer is: it depends — but not in a hand-wavy, consultant-speak kind of way. It depends on very specific, measurable things. How many clicks your site is pulling in per week. What position you're ranking at. What industry you're in.
At Ritner Digital, we track real performance data across client sites every single day. And three sites — one in digital wayfinding and signage, one a marketing agency, and yes, our own SEO and AI search agency website — give us an unusually transparent, side-by-side look at what the path from clicks to leads actually looks like at different traffic levels and ranking positions.
We're including our own data because we think you deserve to see the full picture, not just the client success stories.
Let's get into the numbers.
Why Clicks Are the Only Number That Feeds Your Pipeline
Before we get into the data, it's worth explaining why we care about clicks specifically — not impressions, not rankings in isolation.
Impressions tell you how often your site appeared in a search result. Rankings tell you where. But clicks tell you how many real humans actually chose to visit your site. That's the only number that feeds your lead pipeline.
Research analyzing click-through behavior across millions of Google search results consistently shows that the first organic position captures somewhere around 27–28% of all available clicks, while positions in the 6–10 range pull between 2–5%. By page two, click-through rates fall below 1%.¹ That's not a gradual decline — it's a cliff. Which means your ranking position directly controls how many of your impressions ever become actual website visitors.
And it's those visitors — those clicks — that eventually become leads.
The broadly accepted benchmark for B2B service businesses is that roughly 2–5% of website visitors will take a meaningful conversion action: filling out a contact form, calling, booking a consultation.² That number shifts based on how well your site is built, how relevant your traffic is, and how competitive your niche is. At a 3% conversion rate, you need at minimum 33–34 qualified visitors per week just to have a statistical shot at one lead per week. In practice, because not every click carries the same intent, the real threshold is higher.
That's exactly what the three sites below illustrate — including one where we're not there yet.
Site One: Digital Wayfinding & Signage — 82 Clicks in 7 Days, Weekly Leads
This B2B site operates in the digital wayfinding and signage space — a specialized market serving hospitals, corporate campuses, airports, universities, and large commercial real estate properties. These are high-value contracts. A single closed deal can be worth tens of thousands of dollars.
Here's their exact Google Search Console data for the week of May 5–11, 2026:
That average position — solidly in the 14–15 range — is doing serious work. Someone searching for digital wayfinding solutions and clicking a result in the 14th position is not a casual browser. That's a researcher with a real project and real budget attached to it.
What does 82 clicks a week translate to in leads?
At a conservative 2–3% conversion rate on qualified B2B traffic, 82 clicks per week yields roughly 1–2 leads per week. That lines up exactly with what this client reports. Some weeks it's one solid inquiry. Other weeks it's two or three. The leads aren't random — they're arriving from people who searched for specific solutions (wayfinding software, digital directory systems, hospital navigation signage) and found this site credible enough to reach out.
In a high-ticket niche like digital signage, one lead per week converting at a 10–15% close rate means 5–8 new clients per year from organic search alone. The ROI compounds fast at this level.
The key insight: When your site is ranking in the 13–16 position range with strong niche-specific content, you're pulling in visitors who are already past the awareness stage. They know what they want. The job of good SEO is to make sure they find you — and trust what they see when they arrive.
Site Two: Marketing Agency — 67 Clicks in 7 Days, Solid Monthly Leads
This site belongs to a full-service marketing agency. Same fundamental model — selling services, generating inbound inquiries — but an entirely different competitive landscape. Marketing agency services are one of the most saturated verticals in organic search. Solo freelancers, boutique shops, regional agencies, and global holding companies all compete for the same keyword real estate.
Here's their Google Search Console data for the same week:
Notice the contrast immediately. Similar raw click volume to Site One — 67 versus 82 — but the average position is 32 compared to 15. This site is getting its clicks from page 3 and beyond. Higher impressions relative to clicks, lower CTR, and traffic that is more mixed in terms of buyer intent.
This site actually generates more total impressions per day than the wayfinding site — over 5,000 daily versus roughly 4,500. The gap in clicks isn't a visibility problem. It's a position problem. The traffic is out there. It's just not clicking through at the same rate because the ranking depth suppresses CTR.
What does 67 clicks a week translate to in leads?
In competitive service niches like marketing, searchers are frequently in early research mode — comparing multiple agencies, not necessarily ready to call today. Conversion rates in this environment typically run closer to 1.5–2.5%.³ At that rate, 67 weekly clicks (roughly 270 per month) yields approximately 4–7 leads per month. This client typically sees 3–5 strong inbound inquiries per month from organic. One or two per month are genuinely strong fits that move toward proposals. That's a healthy, predictable monthly pipeline.
The key insight: At 60–70 clicks per week in a competitive niche with mid-to-deep page rankings, you're solidly in the monthly leads zone. The path to weekly leads isn't only about adding more total clicks — it's about moving up in position. Getting from average position 32 to average position 15 on core terms would dramatically shift lead frequency from monthly to weekly.
Site Three: Ritner Digital (Us) — 43 Clicks in 7 Days, No Leads Yet
Here's where we get honest.
This is our own website. Ritner Digital is an SEO and AI search agency — which means we operate in arguably the most competitive digital marketing niche that exists. Every SEO agency, content marketing firm, and AI-powered marketing tool vendor is competing for the same search real estate we are.
Here's our Google Search Console data for the week of May 5–11, 2026:
43 clicks last week. Average position 18. And leads? Zero. We did receive one inquiry — someone trying to sell us a tech tool. That doesn't count.
We want to be straightforward about what this means and what it doesn't mean.
What it means: We're in the early-to-mid stage of our own organic growth. 43 clicks per week at an average position of 18 puts us right at the threshold where leads can start appearing occasionally — but aren't yet consistent. The math is unforgiving: at a 2–3% conversion rate, 43 clicks produces roughly 0.8–1.3 leads per week in expectation. In reality, because SEO and AI search is a brutally competitive niche with high-intent but also highly educated and skeptical searchers, that conversion rate may run lower than average. We're building toward it.
What it doesn't mean: It doesn't mean our SEO isn't working. Our impression volume — around 2,000–2,400 per day — is growing. Our CTR of 0.3–0.5% on good days is actually solid for position 18. And our average position, while in the high teens, has room to move. The trajectory matters as much as the snapshot.
There's also something worth noting in our own data: May 6 was our best day of the week — 12 clicks, 0.5% CTR, position 17.9. May 9 was zero. That volatility at low click volumes is completely normal. When you're pulling 5–12 clicks per day, a single slow day looks like a cliff. When you're pulling 80+ per day like the wayfinding site, a slow day is barely visible in the trend line.
The uncomfortable truth we're sharing publicly: We are an SEO agency that is currently doing SEO on our own site and not yet seeing inbound leads from it. We think that's worth saying out loud, because anyone who tells you SEO produces overnight results — including SEO agencies marketing their own services — is not being straight with you. We're building. We know what the path looks like. And the data tells us we're on it.
The Position Gap Is the Real Story Across All Three Sites
Here's the summary that connects all three:
What stands out is that raw click volume alone doesn't tell the full story. The wayfinding site has more clicks AND a better position. The marketing agency has fewer clicks AND a worse position — but it's still generating monthly leads because the volume is enough to produce conversions even at lower intent levels. Ritner Digital has moderate clicks and a moderate position, sitting in the zone where leads are theoretically possible but not yet reliable.
CTR data from large-scale studies of Google search behavior consistently shows that positions 1–10 capture the substantial majority of organic clicks, positions 11–20 still capture meaningful share, and positions 21–40 depend heavily on high search volume terms just to generate real traffic at all.⁴ Our own data confirms this: on days where our position dips toward 19–20, clicks fall sharply. On days where we're closer to 15–16, clicks spike.
The leverage point in organic search is position improvement, not just content volume. Moving from position 18 to position 12 on core terms — which is very achievable with consistent SEO work over the next 60–90 days — would likely double our weekly click volume without a single new page being published.
Why the Same Click Count Produces Different Lead Timelines
Niche intent matters enormously, independent of click volume or position.
Digital wayfinding and signage is a high-specificity, high-intent vertical. When someone searches for "digital wayfinding software for hospitals" or "indoor navigation signage solutions," they're almost certainly a decision-maker or procurement researcher with a real project in mind. Low search volume, extremely high intent. 80+ clicks per week in this niche produces weekly leads because the visitors are ready to engage.
Marketing agency services sit at the crossroads of high search volume and high competition. Terms like "digital marketing agency" or "SEO services" attract enormous query volume but represent a massive range of intent — from business owners with budget to students writing papers. Natural dilution of intent means conversion rates run lower, and it takes more total traffic to produce the same number of decision-ready leads.
SEO and AI search agency is a niche within a niche — and an emerging one at that. "AI search agency" and related terms are queries that are growing fast as businesses try to understand how to optimize for AI-driven search engines like Perplexity, ChatGPT search, and Google's AI Overviews. The searchers who find us are often genuinely curious and well-informed, but the category is new enough that many are still in education mode rather than buying mode. As the niche matures and query intent sharpens, conversion rates will improve alongside it.
Practical Click Benchmarks for B2B Service Businesses
Based on what Ritner Digital is seeing across client sites and our own data, here are realistic click-count benchmarks for B2B service businesses:
Fewer than 30 clicks per week: Early-stage organic territory. Leads from SEO will be sporadic — one or two per month in a good month. The priority is content development and ranking improvement, not lead volume expectation.
30–50 clicks per week: Leads are possible but inconsistent. High-intent niches may see the occasional inquiry. Competitive niches will still be mostly quiet. This is the zone where the work being done now is setting up results three to six months from now.
50–70 clicks per week: Building toward monthly leads. Depending on niche and position, expect 1–4 meaningful inquiries per month. Quality and frequency will vary week to week.
70–90 clicks per week: The monthly-to-weekly transition zone. High-intent niches may begin seeing weekly leads. Broader, more competitive niches will still be in the monthly range but with more consistency.
90–120 clicks per week: Weekly leads become the expectation in most B2B niches, assuming your site converts well and your average position is in the 10–20 range. This is where organic search starts functioning as a reliable pipeline.
120+ clicks per week: Consistent weekly leads, often multiple per week. The focus shifts from generating leads to qualifying them efficiently.
What to Look at in Your Own Data Right Now
If you're staring at Google Search Console trying to figure out whether your SEO is working, here's the framework:
Find your average position. Are you in the 1–15 range? The 15–30 range? Deeper? Your position range tells you how efficiently your existing clicks are converting into leads. The same 70 clicks behave very differently at position 14 versus position 33.
Look at your 60–90 day click trend. Growing, flat, or declining? Slow, consistent growth in clicks over two to three months is one of the clearest signals that your investment is compounding correctly.
Benchmark against your niche, not generic averages. A specialty B2B site seeing 60 clicks per week at position 14 is performing well. A general consumer-facing site at the same metrics is in early stages. Context changes the entire interpretation.
Stop treating impressions as a success metric. High impressions with low CTR — like the marketing agency site generating 5,000+ impressions per day at 0.1–0.2% CTR — is visibility without action. Impressions without clicks are billboards on an empty highway.
Be patient with the compounding, but stay active. The wayfinding site's improvement from position 18 to position 14 over 90 days was the result of consistent, systematic work. That four-position improvement likely increased weekly click volume by 35–45% on its own. That's the leverage point in SEO — the gains aren't linear, they're exponential as you cross from page two to page one.
The Bottom Line
Three real sites. Real Google Search Console data. Three very different places on the same journey.
The digital wayfinding and signage site — 82 clicks per week at average position 14.7 — is generating leads weekly. High-intent niche, strong position, consistent traffic from researchers who are ready to engage.
The marketing agency site — 67 clicks per week at average position 32.1 — is generating solid leads monthly, with a clear path toward weekly frequency as rankings improve toward page one on core terms.
Ritner Digital — our own site — 43 clicks per week at average position 18.0 — is in the build phase. No consistent inbound leads yet from organic. We know exactly what the data says and exactly what it will take to move the needle. We're doing the work.
That's what real SEO looks like. Not traffic spikes. Not overnight rankings. Not an agency with a perfect website pretending they have all the answers. Just a clear-eyed understanding of where you are in the journey, what the data tells you, and what consistent, strategic work over time actually produces.
We're building our own pipeline the same way we build our clients'.
Curious what your current click volume and ranking position suggest about your lead potential? We work with B2B service businesses to build organic pipelines that produce real, measurable results.
Talk to the Ritner Digital team → ritnerdigital.com
Sources:
Backlinko, "Google Click Through Rates (CTRs) by Ranking Position" — analysis of organic CTR distribution across search result positions.
WordStream / HubSpot B2B Conversion Rate Benchmarks — average contact form and landing page conversion rates for professional service businesses.
First Page Sage, "B2B Website Conversion Rate Benchmarks by Industry" — conversion rate ranges for marketing agency and professional services verticals.
Advanced Web Ranking, "Organic CTR Study" — click-through rate distribution across Google search result pages 1–3.
Frequently Asked Questions
How many clicks does a B2B website need to generate its first lead from organic search?
Most B2B service websites begin seeing their first occasional inbound leads from organic search somewhere in the 30–50 clicks per week range. At that level, leads are inconsistent — you might go two or three weeks with nothing and then get two inquiries in the same week. For reliable, repeatable lead generation, the threshold for most B2B niches is closer to 80–100 clicks per week, combined with an average ranking position in the top 20 results on Google.
Why is my site getting thousands of impressions but almost no clicks?
Impressions and clicks are not the same thing, and a large gap between them almost always points to a ranking position problem. If your site is appearing on page two or page three of Google results, your click-through rate will typically fall below 1% regardless of how many times you appear. The fix is not to generate more content for the same deep-ranking pages — it's to systematically improve the position of your most important pages so they cross from page two onto page one, where click-through rates increase dramatically.
What is a realistic conversion rate for a B2B service website?
For most B2B service businesses, a realistic website conversion rate — meaning the percentage of visitors who take a meaningful action like submitting a contact form or calling — falls between 2% and 5%. High-intent, specialized niches like technical B2B solutions or niche professional services tend to sit toward the higher end of that range. Competitive, broad-category niches like general marketing services or business consulting tend to sit closer to 1.5–2.5% because the traffic includes more early-stage researchers alongside ready-to-buy prospects.
How long does it take for SEO to start producing leads?
For most B2B websites starting from a low base, meaningful organic lead generation typically begins to appear somewhere between six and twelve months of consistent SEO investment. The first three months are primarily about technical cleanup, content foundation, and initial ranking movement. Months four through six typically show growing click volume and early occasional leads. Months six through twelve are where compounding kicks in and leads become more predictable. This timeline can be shorter for niche markets with lower competition and longer for highly competitive verticals.
Does ranking position matter more than total click volume for lead generation?
Both matter, but ranking position has a multiplier effect on click volume that makes it the higher-leverage variable of the two. A site ranking at position 14 with 80 clicks per week is generating those clicks far more efficiently — and from higher-intent visitors — than a site at position 32 generating the same 80 clicks. Improving your average position from 32 to 14 on your core pages would likely double or triple your click volume automatically, without publishing a single new piece of content. Position improvement is the lever. Click volume is the result.
Why does niche matter so much for converting clicks into leads?
Different search queries carry fundamentally different levels of buyer intent. Someone searching for "digital wayfinding software for hospitals" has a specific, high-intent need and is likely deep in a buying process. Someone searching for "digital marketing agency" could be a business owner with budget, a student doing research, or someone who just wants to understand what agencies do. The same number of clicks from those two queries will produce very different lead conversion rates, because the intent behind the click is completely different. Understanding where your niche sits on the intent spectrum is essential for setting realistic expectations about how many clicks you need to generate leads.
Our site has more impressions than our competitors but fewer leads — what's going wrong?
Impressions without clicks mean your site is visible but not compelling enough at the search result level to earn the visit. This is usually either a ranking position issue — you're appearing on page two or three where almost no one clicks — or a title and meta description issue, where your search snippet isn't written in a way that matches what the searcher is looking for. In some cases it's both. The solution is to audit which pages are generating high impressions with low CTR, improve their ranking position through on-page optimization and link building, and rewrite their meta titles and descriptions to directly address the search intent behind the queries driving those impressions.
Is 43 clicks per week enough to generate leads for an SEO agency?
Honestly, not yet consistently — and we say that about our own site. At 43 clicks per week and an average position of 18, the math puts expected weekly leads at under one. In a competitive niche like SEO and AI search marketing, where searchers are educated and skeptical, conversion rates may run lower than average B2B benchmarks. The path forward is clear: improve average position from 18 toward 12–14 on core terms, which would likely push weekly clicks into the 70–90 range, and from there into consistent monthly and eventually weekly lead territory. We're doing exactly what we tell our clients to do — and we're at the same stage in the process that many of them are when they first come to us.
Still have questions about what your site's data is telling you? We're happy to take a look.