Ritner Digital August 2026 SEO Benchmark Report
Every month we publish our own Google Search Console data next to a real client's and walk through what happened. No cherry-picked screenshots, no vanity dashboards: the actual numbers, the actual context, and what we're doing about them. If you've read our April, May, June or July reports, you know the drill.
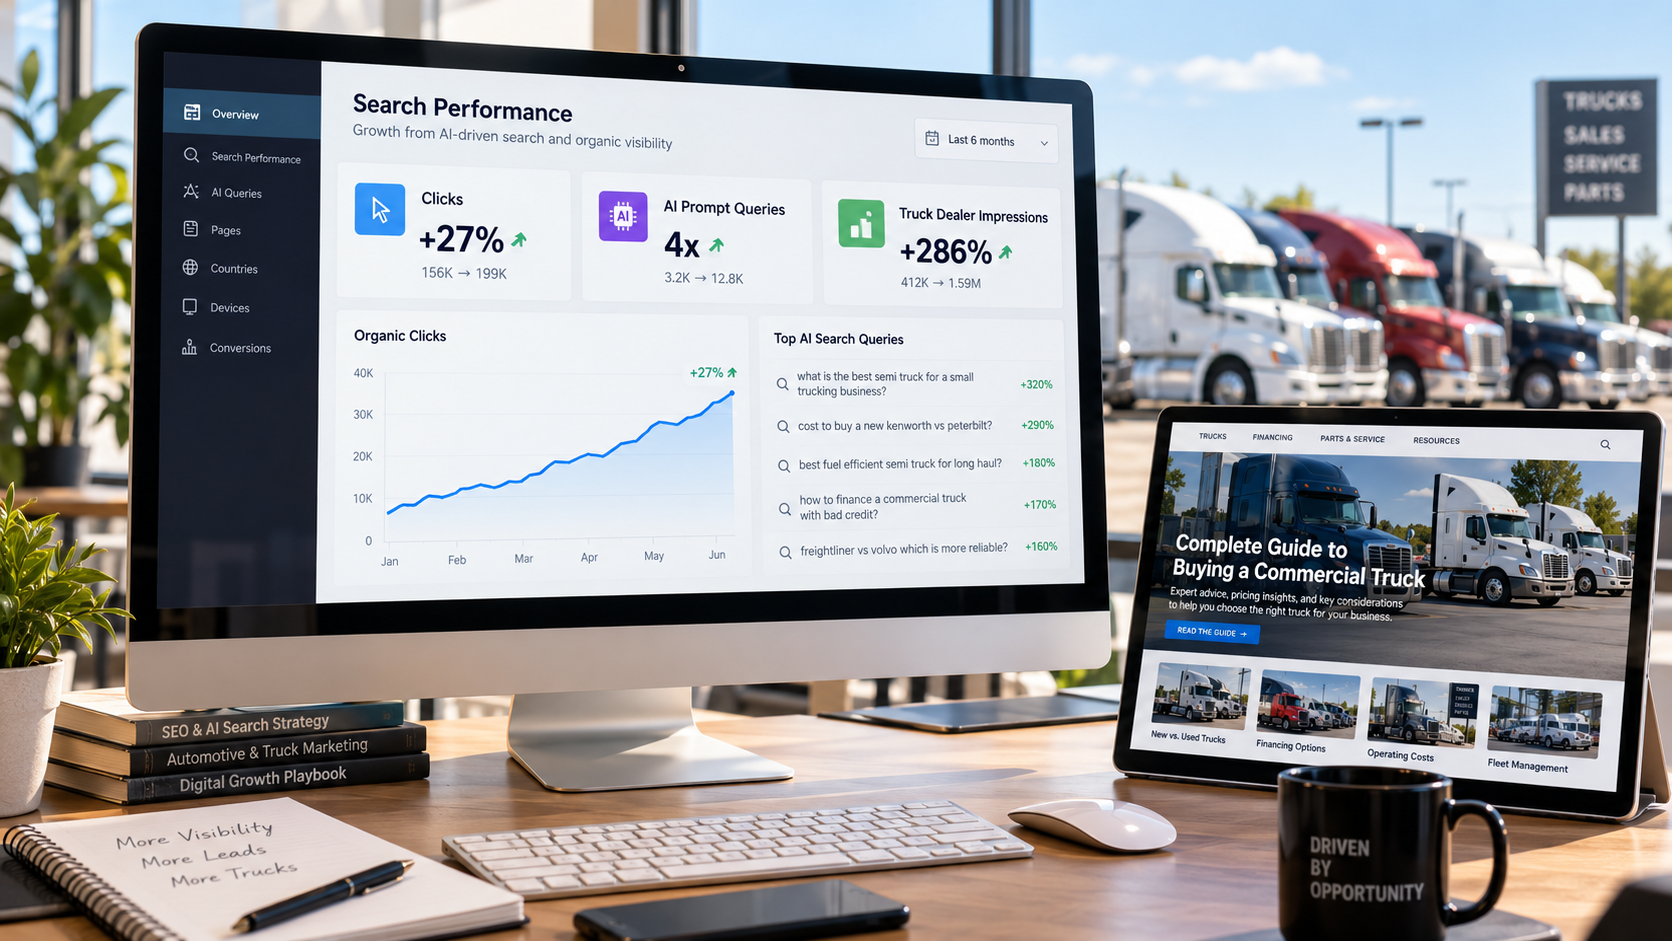
August was a growth month on both sides of this report. Clicks grew 27% on our site and 52% on the client's. It was also the first month where a noticeable share of our impressions came from something that isn't quite a person: searches that read like prompts written for an AI tool. We'll show you what that looks like in Search Console, because it's coming to your data too.
Part One: How Ritner Digital's own site performed in August 2026
We benchmark our own site against the prior month, so everything in this section is August 1–31, 2026 compared against July 1–31, 2026, straight from Google Search Console (web search).
Last month, clicks grew about twice as fast as impressions. This month it flipped: impressions grew faster than clicks, so click-through rate dipped and average position held roughly flat.
In July we said that when impressions outrun clicks, you're being seen for more things but not chosen. That's usually the right read. This month it's only part of the story. A meaningful slice of the new impressions came from searches no human would type, and they almost never click. That's the next section.
Before we get there, the plain headline: 882 clicks, up from 694 in July and 557 in June. That's two consecutive months of 24%-plus click growth.
The machines showed up in our Search Console
Scroll far enough down our August query report and you hit searches like these:
Nobody types "answer yes/no or 'i don't have the answer'" into Google. That's an instruction to an AI model. These queries look like prompts: long, fully punctuated, sometimes with formatting rules attached. Our best read is that they come from AI visibility trackers and AI assistants that run searches on a user's behalf, then read the results instead of clicking them. Google doesn't label them, so we can't prove the source, but the pattern is hard to miss.
And it's growing fast. Here's every query of 12 words or more in our report, month over month:
Impressions from prompt-length queries quadrupled in one month, and they produced one click between them. That matters for anyone reading a Search Console dashboard, because it inflates impressions and drags down CTR without anything being wrong with your pages.
How much of our CTR dip does it explain? Take those impressions out of both months and CTR goes from 0.55% in July to 0.52% in August, instead of 0.54% to 0.49%. So roughly 40% of the dip is machine traffic. The rest is real, and it's mostly desktop: desktop impressions grew 40% at an average position around 17, where clicks are scarce. We'll come back to that.
What to do with this in your own data. In Search Console's performance report, add a query filter set to "Custom (regex)" with ([^ ]+ ){11,}[^ ]+ to isolate queries of 12 words or more. Check how much of your impression growth they account for before you celebrate or panic. We're also treating the topics in these prompts as a signal. People are clearly asking AI tools which agencies and platforms to trust for AI citation tracking, and several of our pages are already being pulled in to answer. That's the audience we want.
The ratchet kept turning
The daily pattern looked a lot like July's. The second half of August (16–31) produced 488 clicks against 394 in the first half, on 98,038 impressions versus 82,348. Our two biggest click days of the month, August 24 (48 clicks) and August 25 (43), both landed in the final week. That's the ratchet we keep describing: pages get indexed, sit quietly, then start compounding.
The week has a shape now, too. Tuesdays averaged 38 clicks and Saturdays about 20. That's a B2B audience reading on work days, which is exactly who we write for.
Mobile is still where the growth lives
Mobile clicks grew 40% for the second month in a row, CTR held steady and position improved again. Mobile now accounts for 42% of our clicks, up from 38%.
Desktop is where the CTR slide happened. Desktop still delivers the most clicks, and they grew 18%. But desktop impressions jumped 40% at an average position just past 17, which is the second page for most queries. Mobile is converting what it earns. Desktop is earning more than it converts.
What people clicked
The Claude pair keeps growing. Together they earned 147 clicks, up from 91, and the "meaner" post more than doubled its impressions. The Snapchat piece nearly quadrupled on both clicks and impressions. The Utah post more than doubled, and its California sibling went from 8 clicks to 17, so the "biggest brands born in" series is becoming a format rather than a one-off.
The breadth matters more than any single page. 176 pages earned at least one click in August, up from 127 in July. And 345 pages earned impressions in August that had none in July. Those newly visible pages produced 103 clicks and 17,019 impressions on their own, led by our guide to the phrases that give away AI writing (20 clicks in its first month).
Not everything went up, and we publish those too. Our explainer on impressions dropping while average position rises fell from 25 clicks to 7 as its position slipped from 12 to 15. The sitemap-in-your-footer post dropped from 25 to 16. The Canva transparent-background guide earned just 3 clicks on 7,457 impressions at position 9 — a title and snippet problem, not a ranking one, and the fix is a rewrite. Our homepage slipped from 15 clicks to 12 and its average position from 5.2 to 10.5, which we're watching.
The impression bank, updated
These are pages Google already understands but hasn't moved into click territory yet. That's the to-do list for September:
The last two rows are the ones we're most excited about. Both are about AI search measurement, the topic those prompt-shaped queries keep asking about, and both climbed sharply in a single month. The domain authority page is the single biggest opportunity on the site. Moving it from position 18 onto page one is worth more than any new post we could write.
More than half our clicks come from outside the U.S.
The U.S. drove 428 clicks, up from 341, on impressions that grew 53%. Every other country combined drove 454, up from 353, so international clicks outnumbered domestic ones for the second month running. Canada (49, up from 35), Australia (43, up from 28), the UK (68), Germany (25) and Spain (14, up from 6) led the way, and 73 countries sent at least one click, up from 62. That's what writing about topics that aren't tied to one market does.
That's our house. Now let's look at a client's.
Part Two: Client benchmark — True Blue Autos, August 2026
True Blue Autos is a used truck and commercial vehicle dealership in Greensburg, Indiana, and our featured client for the second month running. That lets us do something a one-off case study can't: show you the same site, month over month, with the prior month sitting right next to it.
Search Console: impressions nearly quadrupled
Clicks up by half. Impressions nearly four times higher. Average position better by more than four spots. And CTR down by more than half, which on its own would look like a problem. It isn't one, and the reason is the best part of this month's report.
The daily chart shows exactly when it happened. From August 1 to 9, the site averaged about 470 impressions and 11 clicks a day. From August 10 on, it averaged about 1,480 impressions and 17 clicks a day. The step never came back down.
The new truck content arrived all at once
In July, True Blue's blog content was almost entirely about shipping: what it costs to move a truck across the country, door-to-door versus terminal delivery, how long it takes. In August, a new layer showed up in Search Console: about twenty commercial-truck buyer guides that had zero impressions in July.
Together, those commercial-truck pages earned about 123 clicks and 21,700 impressions in their first month. Most of them rank between positions 5 and 9 already. That's page one, in the first month, for comparison queries asked by business buyers across the country.
That's also why CTR fell. Comparison and spec queries are research queries. Someone searching "f350 vs f450 payload" or "do you need a cdl to drive a f750" wants an answer, and the results page often gives it to them before they click. These pages convert at under 1% CTR from the first page, compared with the 30–50% CTRs of branded searches. Add 21,700 impressions at that rate to a site whose July traffic was mostly branded, and the site-wide CTR has to fall. That's what building an informational layer looks like in the numbers.
The payoff shows up in who's finding the site. Blog and guide pages combined went from 18 clicks in July to about 150 in August, roughly eight times as many. Queries mentioning specific Ford models, GVWR, payload, CDL rules or Power Stroke engines went from about 320 impressions to 1,741 in the query report. For a dealer whose inventory is F-550s, F-750s and Ram 4500s, those are exactly the right strangers.
The shipping content, meanwhile, kept doing its job: 27 clicks, up from 18, on about 6,450 impressions. The cost-to-ship-a-truck guide climbed from position 9.4 to 6.6.
The branded base held, and the homepage climbed
Branded searches stayed steady at the top of the click column. "True blue auto" drove 70 clicks, "true blue autos" 54 at a 41% CTR, and "true blue auto greensburg indiana" 22 at a 54% CTR from position 1. Branded queries in the report delivered 162 clicks, up from 151.
The homepage earned 302 clicks, up from 272, and its average position improved from 16.0 to 11.8. That's the foundation we described in July, still intact under a lot of new growth.
One honest soft spot: local non-branded searches. Queries containing "Greensburg" produced 42 clicks, down from 55, even though their impressions grew slightly. "Greensburg indiana car dealerships" went from 8 clicks to 3. Local rankings are mostly in the 7–10 range, which is the bottom of page one. That's a Google Business Profile and local-content job for September, not a content-volume one.
Devices: desktop caught up
In July we called desktop the soft flank, at position 17.7. In August it moved to 10.6.
Mobile still delivers 71% of clicks, up 66%, at an average position of 6.5. Desktop grew 40% on clicks and gained seven spots. The truck comparison guides are the likely reason. Business buyers researching an F-550 against an F-750 do a lot of that at a desk.
Two technical cleanups we found in the data
The page report surfaced two things worth fixing:
Tag archives are being indexed. Sixty-eight /tag/ pages showed up in Search Console with 2,774 impressions and 3 clicks between them. They're thin pages competing with the real articles. The fix is to noindex them.
An http version of the homepage is showing up. http://www.trueblueautos.com/ earned 162 impressions of its own. It should 301 to the https homepage in one hop, so all of that equity lands in one place.
Google Analytics: every channel, not just Google
Search Console only covers Google organic. GA4 covers everything, and True Blue's August was big across the board: 9,291 sessions from 7,613 users and 17,125 page views, up 65%, 67% and 70% from July.
Paid social more than doubled and is still the awareness engine. Organic search grew 83%, and it's still the channel with the deepest engagement for its size. Those 715 sessions produced more than 18 hours of engaged time (up 125%), 2,494 page views and 13,781 events. People who arrive from search came looking for something specific, and they stay.
Organic social fell by more than half, and paid search slipped 14%. Neither is an SEO lever, but both belong in the monthly conversation, because the channels feed each other. Someone who sees a truck on Facebook may search the dealership's name a week later.
Site-wide engagement improved as well. Engagement rate rose to 42.5% from 38%, bounce rate improved by about 7%, and pages per session ticked up to 1.84. Average session duration slipped slightly, to 1 minute 21 seconds. The inventory is still where people go: /inventory/ drew 9,078 views, more than half the site's total, followed by the homepage (1,755) and individual listings like an F-150 SuperCrew (1,103) and a Ram 3500 regular cab chassis (964).
What the two sites have in common
Two very different businesses produced the same shape of month.
Impressions outran clicks on both, for good reasons. On our site, part of the surge was prompt-shaped machine queries that never click. On True Blue's, it was about twenty new commercial-truck guides ranking on page one for research questions. In both cases CTR fell while the real audience grew. A single CTR number, read without the query mix behind it, would have told the wrong story twice.
Content keeps compounding in steps, not slopes. Our click growth landed in the final week of August. True Blue's impressions stepped up on August 10 and never came back down. Nothing about SEO produces a smooth line.
The branded base is a floor. True Blue's branded clicks held steady while everything around them grew. Our own traffic now comes overwhelmingly from people who didn't know our name when they searched.
Measurement is part of the job. We found machine traffic distorting our CTR and a client with zero conversions being counted. Neither shows up if you only glance at the topline. That's the case for reading the data every month, in public, with last month sitting right next to it.
Your numbers are telling you a story too
If you read this report and realized you don't know how many of your impressions are real people, or how many leads your website produced last month, that's the gap. Somewhere in your Search Console there are pages ranking 15th that should be 5th, prompts from AI tools inflating your impressions, and conversions nobody is counting.
Ritner Digital specializes in SEO and AI search: getting businesses found on Google and cited by ChatGPT, Claude, Gemini and Perplexity. We do it for dealerships in Indiana, and we do it for our own site in public, every month, with the receipts attached.
If you want your digital presence to grow like this — measurably, month over month, with someone accountable for the numbers — let's talk. Reach out to Ritner Digital and we'll look at your data together. The first conversation is just that: a conversation.
Frequently Asked Questions
What is an SEO benchmark report?
It compares a website's search performance for one period against the prior period, in this case August 2026 against July 2026, using Search Console metrics like clicks, impressions, CTR and average position, plus Google Analytics for the client. The comparison is the point. One month's numbers alone don't tell you whether a strategy is working.
Why would CTR go down in a month when clicks went up?
Because CTR is clicks divided by impressions, and impressions can grow faster than clicks for good reasons. New pages ranking for research questions, and searches from AI tools that read results without clicking, both add impressions at a low CTR. Look at clicks, positions and the query mix before treating a CTR drop as a problem.
What are the long, prompt-like queries showing up in Search Console?
They're searches written like instructions to an AI model: long, fully punctuated, sometimes with formatting rules such as "answer yes/no." They most likely come from AI assistants and AI visibility trackers that search Google for a user and read the results. On our site, queries of 12 or more words went from 2,573 impressions in July to 10,356 in August, with one click.
How do I filter those queries out of my Search Console data?
In the Performance report, add a Query filter, choose "Custom (regex)," and use a pattern that matches 12 or more words, such as ([^ ]+ ){11,}[^ ]+. Compare your totals with and without them. On our site, removing them explained roughly 40% of the month's CTR dip.
Why did True Blue Autos' impressions nearly quadruple in one month?
About twenty new commercial-truck buyer guides — F-550 vs F-750, F-350 vs F-450, service body sizing and more — started ranking in August, mostly between positions 5 and 9. Together they earned roughly 21,700 impressions and 123 clicks in their first month, on queries from business truck buyers nationwide.
Why does it matter that GA4 recorded zero conversions?
Because without key events, Analytics can't tell you which traffic produces leads. True Blue's sessions grew 65%, but until finance applications, forms and calls are marked as key events, nobody can connect that growth to buyers. It's one of the most common and cheapest problems to fix on a dealer site.
How long does it take for new content to show up like this?
It varies, but the pattern in both datasets is typical. Pages get indexed, build impressions for a few weeks, then start earning clicks. True Blue's truck guides reached page one in their first month. Expect meaningful movement in three to six months, then compounding.
Do AI search and SEO require different strategies?
Mostly no. The same things that earned these results — clear pages that answer specific questions, accurate facts, consistent publishing — are what AI tools retrieve and cite. This month's data even shows the overlap directly: AI tools are running searches on Google, and our pages are in the results they read.