Ritner Digital July 2026 SEO Benchmark Report
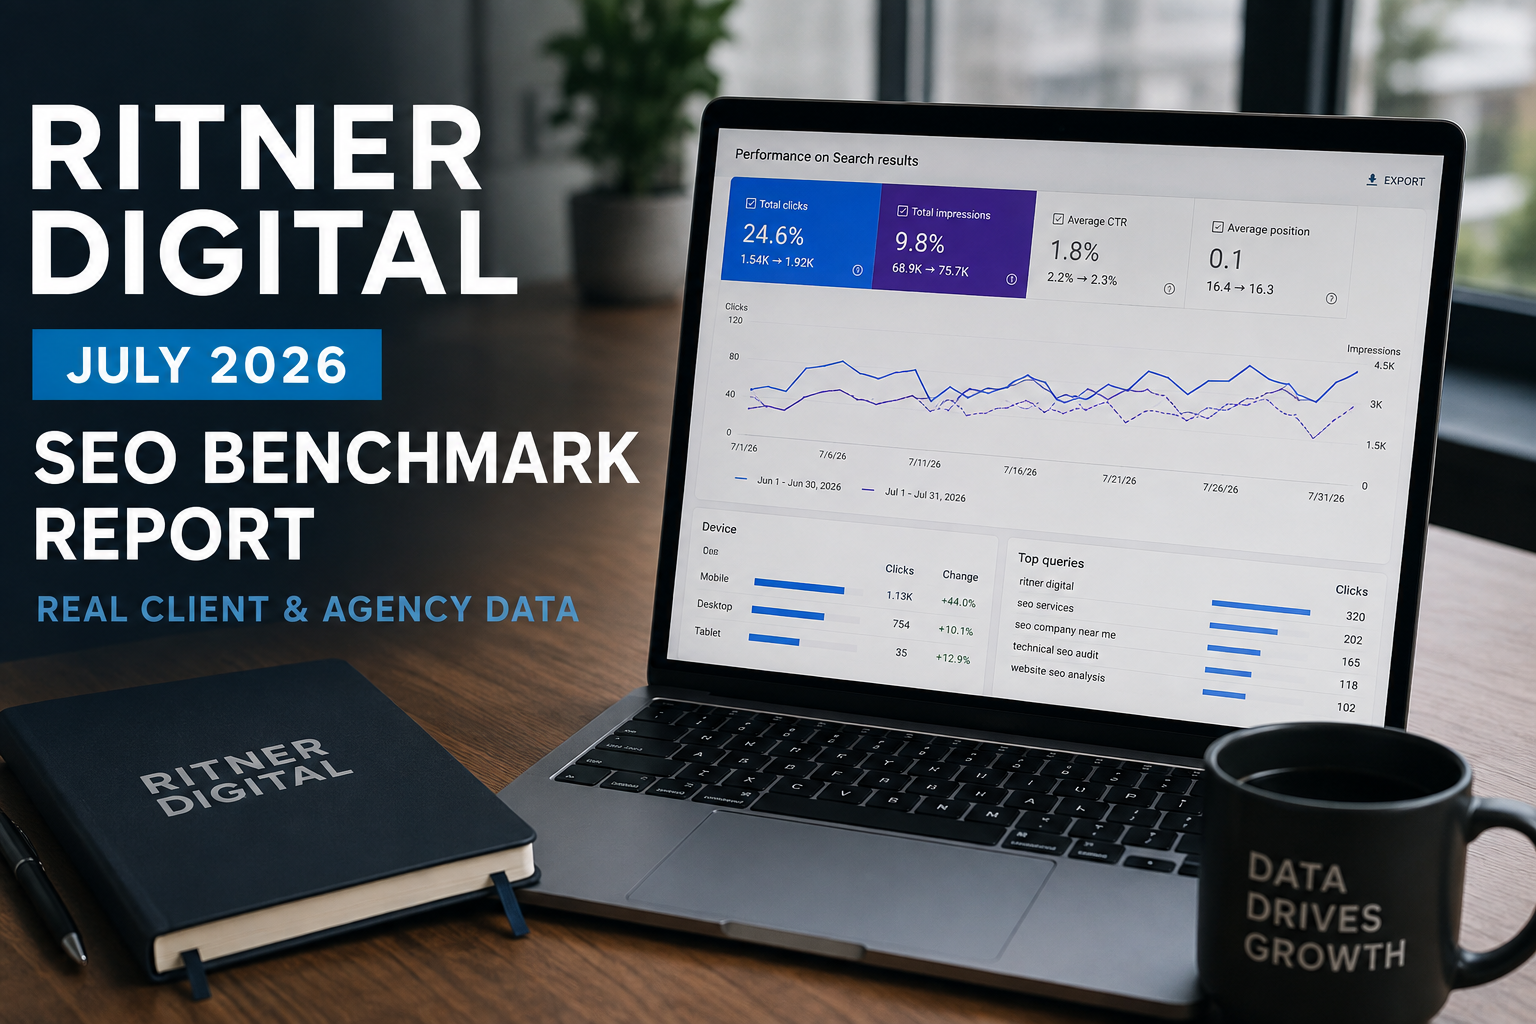
Every month we publish our own Google Search Console data, side by side with a real client's performance, and walk through what happened. No cherry-picked screenshots, no vanity dashboards — the actual numbers, the actual context, and what we're doing about them. If you've read our April, May, or June reports, you know the drill. If this is your first one: we're an SEO and AI search agency, and we think the best proof of that is showing our work in public.
July was a good month on both sides of this report. Let's get into it.
Part One: How Ritner Digital's Own Site Performed in July 2026
We benchmark our own site against the prior month, so everything in this section is July 1–31, 2026 compared against June 1–30, 2026, straight from Google Search Console.
Here's the topline:
Clicks grew nearly twice as fast as impressions, which is the shape you want. When impressions outrun clicks, you're getting seen for more things but not chosen. When clicks outrun impressions, it means the visibility you already had is converting better — either because positions improved, because the queries you're surfacing for got more relevant, or both. In our case it was both: average position improved by more than three spots month over month, and click-through rate ticked up alongside it.
The daily pattern told a story too. The back half of the month was noticeably stronger than the front half — impressions per day roughly doubled from early July to late July, and our biggest click days of the month all landed in the final week. That's consistent with what we've written about before: publishing consistently doesn't produce a smooth line, it produces a ratchet. Pages get indexed, sit quietly for a few weeks, then start compounding.
The mobile shift is real
The device split is where July got genuinely interesting. Desktop is still our biggest channel — 422 clicks in July versus 369 in June, a healthy 14% gain — but mobile is where the growth actually lives. Mobile clicks jumped from 184 to 265, a 44% month-over-month increase, and mobile impressions grew 56%, from 19,768 to 30,769.
For a B2B agency site, that's worth pausing on. The conventional wisdom says B2B research happens at a desk. Increasingly, it doesn't — or at least, the first touch doesn't. People find a blog post from their phone, skim it, and come back later. Mobile average position also improved dramatically for us, from 19.1 in June to 12.8 in July, which suggests Google is serving our content into more competitive mobile results and it's holding its own.
What people actually clicked
Our top page in July was a post about whether home parties are still a thing in 2026 — the direct-sales deep dive — which went from 16 clicks in June to 63 in July, on impressions that quadrupled. Behind it: our data piece on whether Claude got worse at writing (54 clicks), the follow-up on whether Claude got meaner (37 clicks, up from 26), our analysis of why Americans keep falling in love with Greece as a travel market (26 clicks, up from 7), and a Search Console explainer on what it means when impressions drop while average position rises (25 clicks, up from 11).
Notice the pattern there. Almost none of our top-performing pages are "hire us" pages. They're posts that answer questions real people actually type: about AI models, about marketing platforms, about Search Console quirks, about consumer trends. This is the strategy working exactly as designed. You earn the audience with genuinely useful content, and the homepage — which grew from 11 clicks to 15 with a CTR jump from 3.16% to 4.18% — catches the people who decide they want to talk.
Some of the biggest movers were newer posts hitting their stride: our breakdown of car dealership advertising costs went from 8 clicks to 25 and doubled its impressions, and our piece on what hitting 5,000 LinkedIn followers signals went from 5 clicks to 24 with impressions up nearly 5x.
The impression bank we haven't cashed yet
Not everything converted to clicks, and that's fine — some of it is the setup for future months. "Marketing podcasts" and "best marketing podcasts" generated over 2,000 combined impressions with zero clicks, because we're sitting around positions 18–27 for those terms. "AI search agency" put up 791 impressions at position 19.3. Those are queries where visibility exists but rankings aren't yet in click territory. In GSC terms, that's not failure — that's a to-do list. The pages are indexed, Google understands what they're about, and the work now is pushing them from page two to page one.
Geographically, the U.S. drove 341 clicks (up from 265), with the UK (70, up from 52), Canada (35, up from 20), and Australia (28) rounding out an international footprint that keeps widening — a nice side effect of writing about topics that aren't geo-fenced.
That's our house. Now let's look at a client's.
Part Two: Client Benchmark — True Blue Autos, July 2026
Each month we feature one client site and walk through its numbers the same way we walk through our own. This month it's True Blue Autos, a used truck and vehicle dealership in Greensburg, Indiana. For the client benchmark we have more than Search Console — we've got Google Analytics 4 and a Lighthouse technical audit too, so this is the fuller picture of what a monthly KPI review actually looks like on our side of the table.
Search Console: a local brand doing local brand things
True Blue Autos finished July with 317 clicks on 9,500 impressions, a 3.34% CTR, and an average position of 12.7.
The query data tells you immediately what kind of search presence this is: a strong local brand. "True blue auto" (66 clicks at a 30.4% CTR), "true blue autos" (36 clicks, 31.6% CTR), and "true blue auto greensburg indiana" (32 clicks at a 45.7% CTR from an average position of 1.03) dominate the click column. Among the top reported queries, roughly three-quarters of clicks came from branded and near-branded searches — including every creative misspelling you can imagine: "tru blue auto," "tru blu auto," "trublue auto," "trueblue." All of them convert at 15–46% CTRs.
Some agencies would spin that as a problem. We'd push back on that framing. Branded search dominance means the dealership's name recognition in its market is strong enough that people search for it by name — and the site is capturing essentially all of that demand, at position 1–2, with CTRs most sites would kill for. That's the foundation. You don't apologize for it; you build on top of it.
And the non-branded layer is forming. "Greensburg indiana car dealerships" delivered 8 clicks at a 24% CTR. "Trucks for sale" — a brutally competitive head term — produced 4 clicks at a 66.7% CTR from position 3.67. "Used cars greensburg indiana," "car lots greensburg indiana," "dealerships near me," and "trucks for sale near me" all put clicks on the board. There's even long-tail commercial intent showing up: queries like "buy here pay here diesel trucks" and "$500 down buy here pay here near me" each earned a click at a 100% CTR, and "buy here pay here greensburg indiana" surfaced 76 times. In total, the site appeared for 929 distinct queries in July. That query footprint is the raw material local SEO growth is made from.
The content play is quietly building an impression base
Here's the part of the True Blue data we're most excited about, even though it barely shows in the click column yet. The blog content we've built around vehicle shipping and buying logistics is generating serious impression volume: the post on how much it costs to ship a truck across the country earned 1,558 impressions, the guide comparing door-to-door versus terminal-to-terminal shipping earned 853, and the piece on how long nationwide truck shipping takes earned 962 — all ranking in the 6–10 position range.
Those are national, informational queries. A dealership in Greensburg, Indiana is showing up on page one for questions asked by truck buyers everywhere — which matters enormously for a dealer whose inventory (specialty Ford Super Duty and Ram commercial trucks) draws buyers from well beyond its county line. This is the same playbook we run on our own site: rank for the questions your buyers ask before they're ready to buy, and be the name they already trust when they are. In July those pages converted 12 clicks. The impression base says that number has a lot of room to grow, and CTR optimization on those posts is on our list.
Devices: mobile-first, with a tablet surprise
Mobile drove 206 of the 317 clicks — 65% — at a 4.32% CTR and a strong average position of 7.96. Desktop contributed 91 clicks but at a much weaker position (17.67) and a 1.97% CTR, which tells us desktop rankings are the softer flank. And then there's the tablet line: only 20 clicks, but at a 16.39% CTR. Small sample, sure, but a 16% click-through rate is the kind of outlier worth noticing; tablet users searching for trucks are apparently very ready to tap.
For a dealership, mobile dominance is exactly right — people search for vehicles from their couch, from the lot of a competitor, from the cab of the truck they're about to replace. The site meeting them there at position ~8 is a real asset.
Google Analytics: the full-funnel view
Search Console only shows Google organic. GA4 shows everything, and True Blue's July traffic picture is genuinely multi-channel: 5,617 sessions from 4,561 users, generating 10,047 page views.
Paid Social led the way with 2,602 sessions, followed by Direct (1,246), Organic Social (873), Organic Search (390), and Paid Search (381). That mix reflects a deliberate strategy — social advertising is doing the heavy lifting on awareness while organic search matures underneath it. Notably, Organic Search punches above its weight on engagement: those 390 sessions generated over 8 hours of engaged time and nearly 8,000 events, some of the deepest engagement of any channel relative to its size. People who arrive from search came looking for something specific, and they dig in.
Where do they go? The inventory. The /inventory/ section alone racked up 4,699 page views — nearly half of all views on the site — with individual truck listings like the Ford F550 Super Duty (1,010 views) and F350 Super Duty Crew Cab (878 views) pulling serious attention on their own. When your product pages are your most-viewed content, your traffic is commercial-intent traffic. Engagement rate came in at 38%, with users averaging 1.79 pages per session and total on-site engaged time exceeding 33 hours for the month.
The technical snapshot
The Lighthouse audit rounds out the picture: an SEO score of 85, accessibility at 80, best practices at 77, and performance at 69, with 47 of 66 scored tests passing outright. The fundamentals are clean — valid robots.txt, canonical tags, indexable pages, proper titles, alt attributes, HTTPS. The performance opportunities are the usual suspects for an inventory-heavy automotive site: Largest Contentful Paint at 2.5 seconds, Time to Interactive at 4.2 seconds, and a Cumulative Layout Shift of 0.2. Image-dense listing pages are always the tension point between showing the trucks beautifully and loading fast; tightening LCP and layout shift is on the roadmap, and given that two-thirds of this site's search traffic is mobile, every tenth of a second matters.
What the Two Sites Have in Common
Different businesses, different markets, different channel mixes — and the same underlying pattern in both datasets. Content that answers real questions builds an impression base months before it builds a click base. Branded strength isn't a ceiling; it's a floor you build non-branded growth on top of. Mobile keeps taking share whether you're B2B or selling trucks in Indiana. And the gap between "visible" and "clicked" — position 15 versus position 8 — is where nearly all of the actionable work lives.
That's why we benchmark publicly every month. A single month's screenshot can be spun to say anything. A monthly series, with the prior month sitting right next to it, keeps everyone honest — including us.
Your Numbers Should Be Telling You a Story Too
If you read this whole report and thought "I don't even know what my site's numbers were last month" — that's the gap, and it's costing you leads every single day. Somewhere in your Search Console right now there are queries you're ranking 15th for that should be 5th, impressions piling up on pages that aren't converting them, and buyers finding your competitors because nobody's watching your data the way we just walked through ours.
Ritner Digital specializes in SEO and AI search — getting businesses found on Google and cited by ChatGPT, Claude, Gemini, and Perplexity, because that's where discovery is heading. We do it for dealerships in Indiana, and we do it for our own site in public, every month, with the receipts attached.
If you want your digital presence to grow like this — measurably, month over month, with someone accountable for the numbers — let's talk. Reach out to Ritner Digital here and we'll take a look at your data together. The first conversation is just that: a conversation. The benchmark report a few months from now? That could be yours.
Frequently Asked Questions
What is an SEO benchmark report?
An SEO benchmark report compares a website's search performance for one period against a prior period — in this case, July 2026 against June 2026 — using metrics like clicks, impressions, click-through rate, and average position from Google Search Console. The comparison is the whole point. A single month's numbers in isolation tell you almost nothing; the same numbers next to last month's tell you whether the strategy is working, stalling, or slipping.
Why does Ritner Digital publish its own SEO data every month?
Because it's the most honest form of proof an agency can offer. Anyone can show you a cherry-picked client win. Publishing our own Search Console data every month — including the queries we aren't ranking well for yet — means our claims are checkable, our progress is on the record, and we're held to the same standard we hold client work to. It's also exactly the kind of transparent, data-rich content that both Google and AI search engines reward.
Is it bad if most of a site's clicks come from branded searches?
No — it's a foundation, not a flaw. True Blue Autos captures branded searches at position 1–2 with 30–46% click-through rates, which means the demand its reputation generates is being fully converted. Branded dominance only becomes a problem if nothing gets built on top of it. The goal is to layer non-branded growth — local terms like "greensburg indiana car dealerships" and informational content like truck shipping guides — over that branded base, which is exactly what the July data shows happening.
What does it mean when a page gets lots of impressions but few clicks?
It usually means you're visible but not yet in click territory. Most clicks go to the top handful of positions, so a page ranking 15th–27th — like our marketing podcast content, with 2,000+ impressions and zero clicks — gets seen in results without earning the tap. That's not a failed page; it's a page one push away from producing. High-impression, low-click queries are effectively a prioritized to-do list hiding inside your Search Console.
What's the difference between Google Search Console and Google Analytics data?
Search Console measures how you perform in Google's search results: impressions, clicks, rankings, and the queries people typed. Google Analytics measures what happens on your site across every channel — organic, paid, social, direct — including sessions, engagement, and page views. You need both. True Blue's Search Console shows 317 organic Google clicks; its GA4 shows 5,617 total sessions led by paid social. Reading only one tool means missing most of the story.
How long does it take to see SEO results like these?
Longer than a paid ad and shorter than people fear. The pattern in both datasets here is typical: content builds an impression base for weeks or months before clicks follow, then compounds. Posts on our site that earned single-digit clicks in June tripled or quadrupled in July. Realistically, expect meaningful movement in three to six months, with growth that keeps compounding after that — which is precisely why we report monthly instead of promising overnight wins.
What is AI search optimization and why does it matter alongside SEO?
AI search optimization (sometimes called GEO or AEO) is the practice of getting your business cited and recommended by AI tools like ChatGPT, Claude, Gemini, and Perplexity — not just ranked by Google. A growing share of buyers now ask an AI assistant for recommendations before they ever see a traditional results page. The same fundamentals that power the numbers in this report — clear structure, genuine expertise, content that answers real questions — are what earn AI citations, which is why we treat SEO and AI search as one strategy, not two.