From 50 to 700 Clicks: Our Real Google Search Console Achievements Timeline (And What It Teaches About How SEO Growth Actually Works)
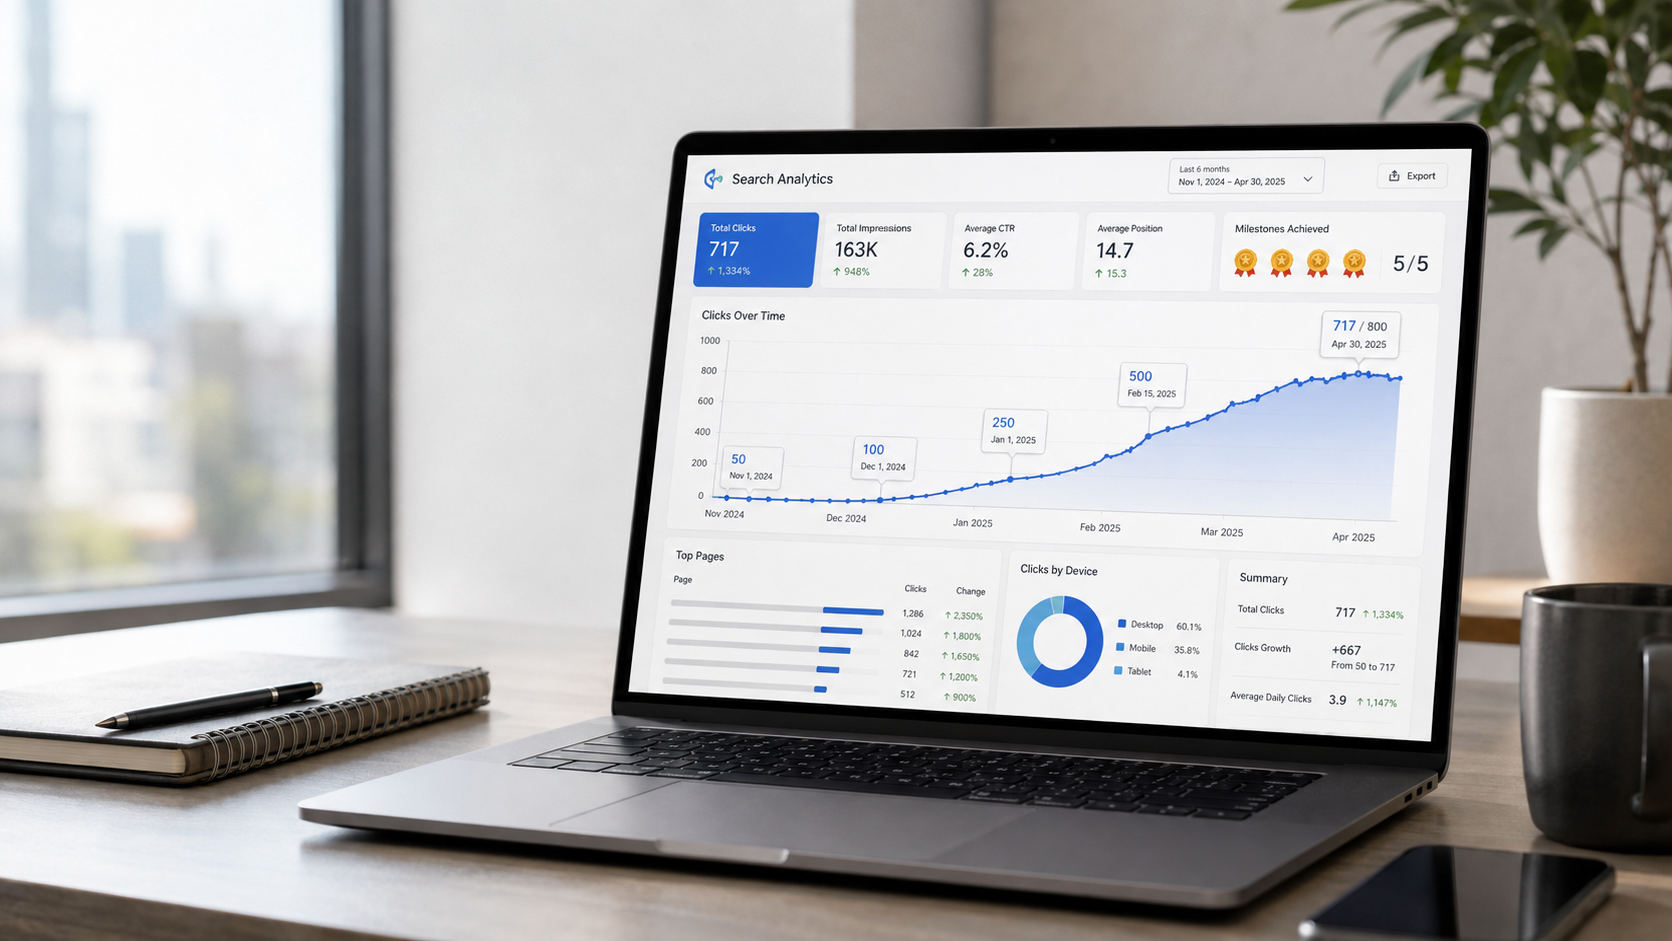
Most marketing agencies tell you SEO compounds. Almost none of them show you their own dashboard.
Today we're doing exactly that. Below is the complete, unedited Achievements timeline from our own Google Search Console — every milestone Google recorded for ritnerdigital.com, with the actual dates, from our first badge in February to today. We're sharing it for two reasons: first, because the Achievements report is one of the most underused (and most misunderstood) features in Search Console, and most site owners don't even know where it lives. Second — and more importantly — because the spacing between the dates tells the single most valuable truth about SEO that no amount of theory can: growth starts painfully slow, then compounds violently, then breathes.
If you've ever stared at your own analytics three months into an SEO effort wondering whether anything is working, this post is the reality check — in both directions.
First: What Is the Achievements Report in Google Search Console?
If you've never seen it, you're not alone. Achievements is one of Search Console's newest features — Google announced it in September 2025, turning what used to be occasional congratulatory emails into a permanent report inside the console. Here's how it works:
It tracks click milestones on a rolling 28-day window. When your site crosses a click threshold from Google Search for the first time — 50 clicks in 28 days, then 60, 70, 80, and so on up through the hundreds and thousands — Search Console records the milestone, timestamps it, and typically sends a celebratory email.
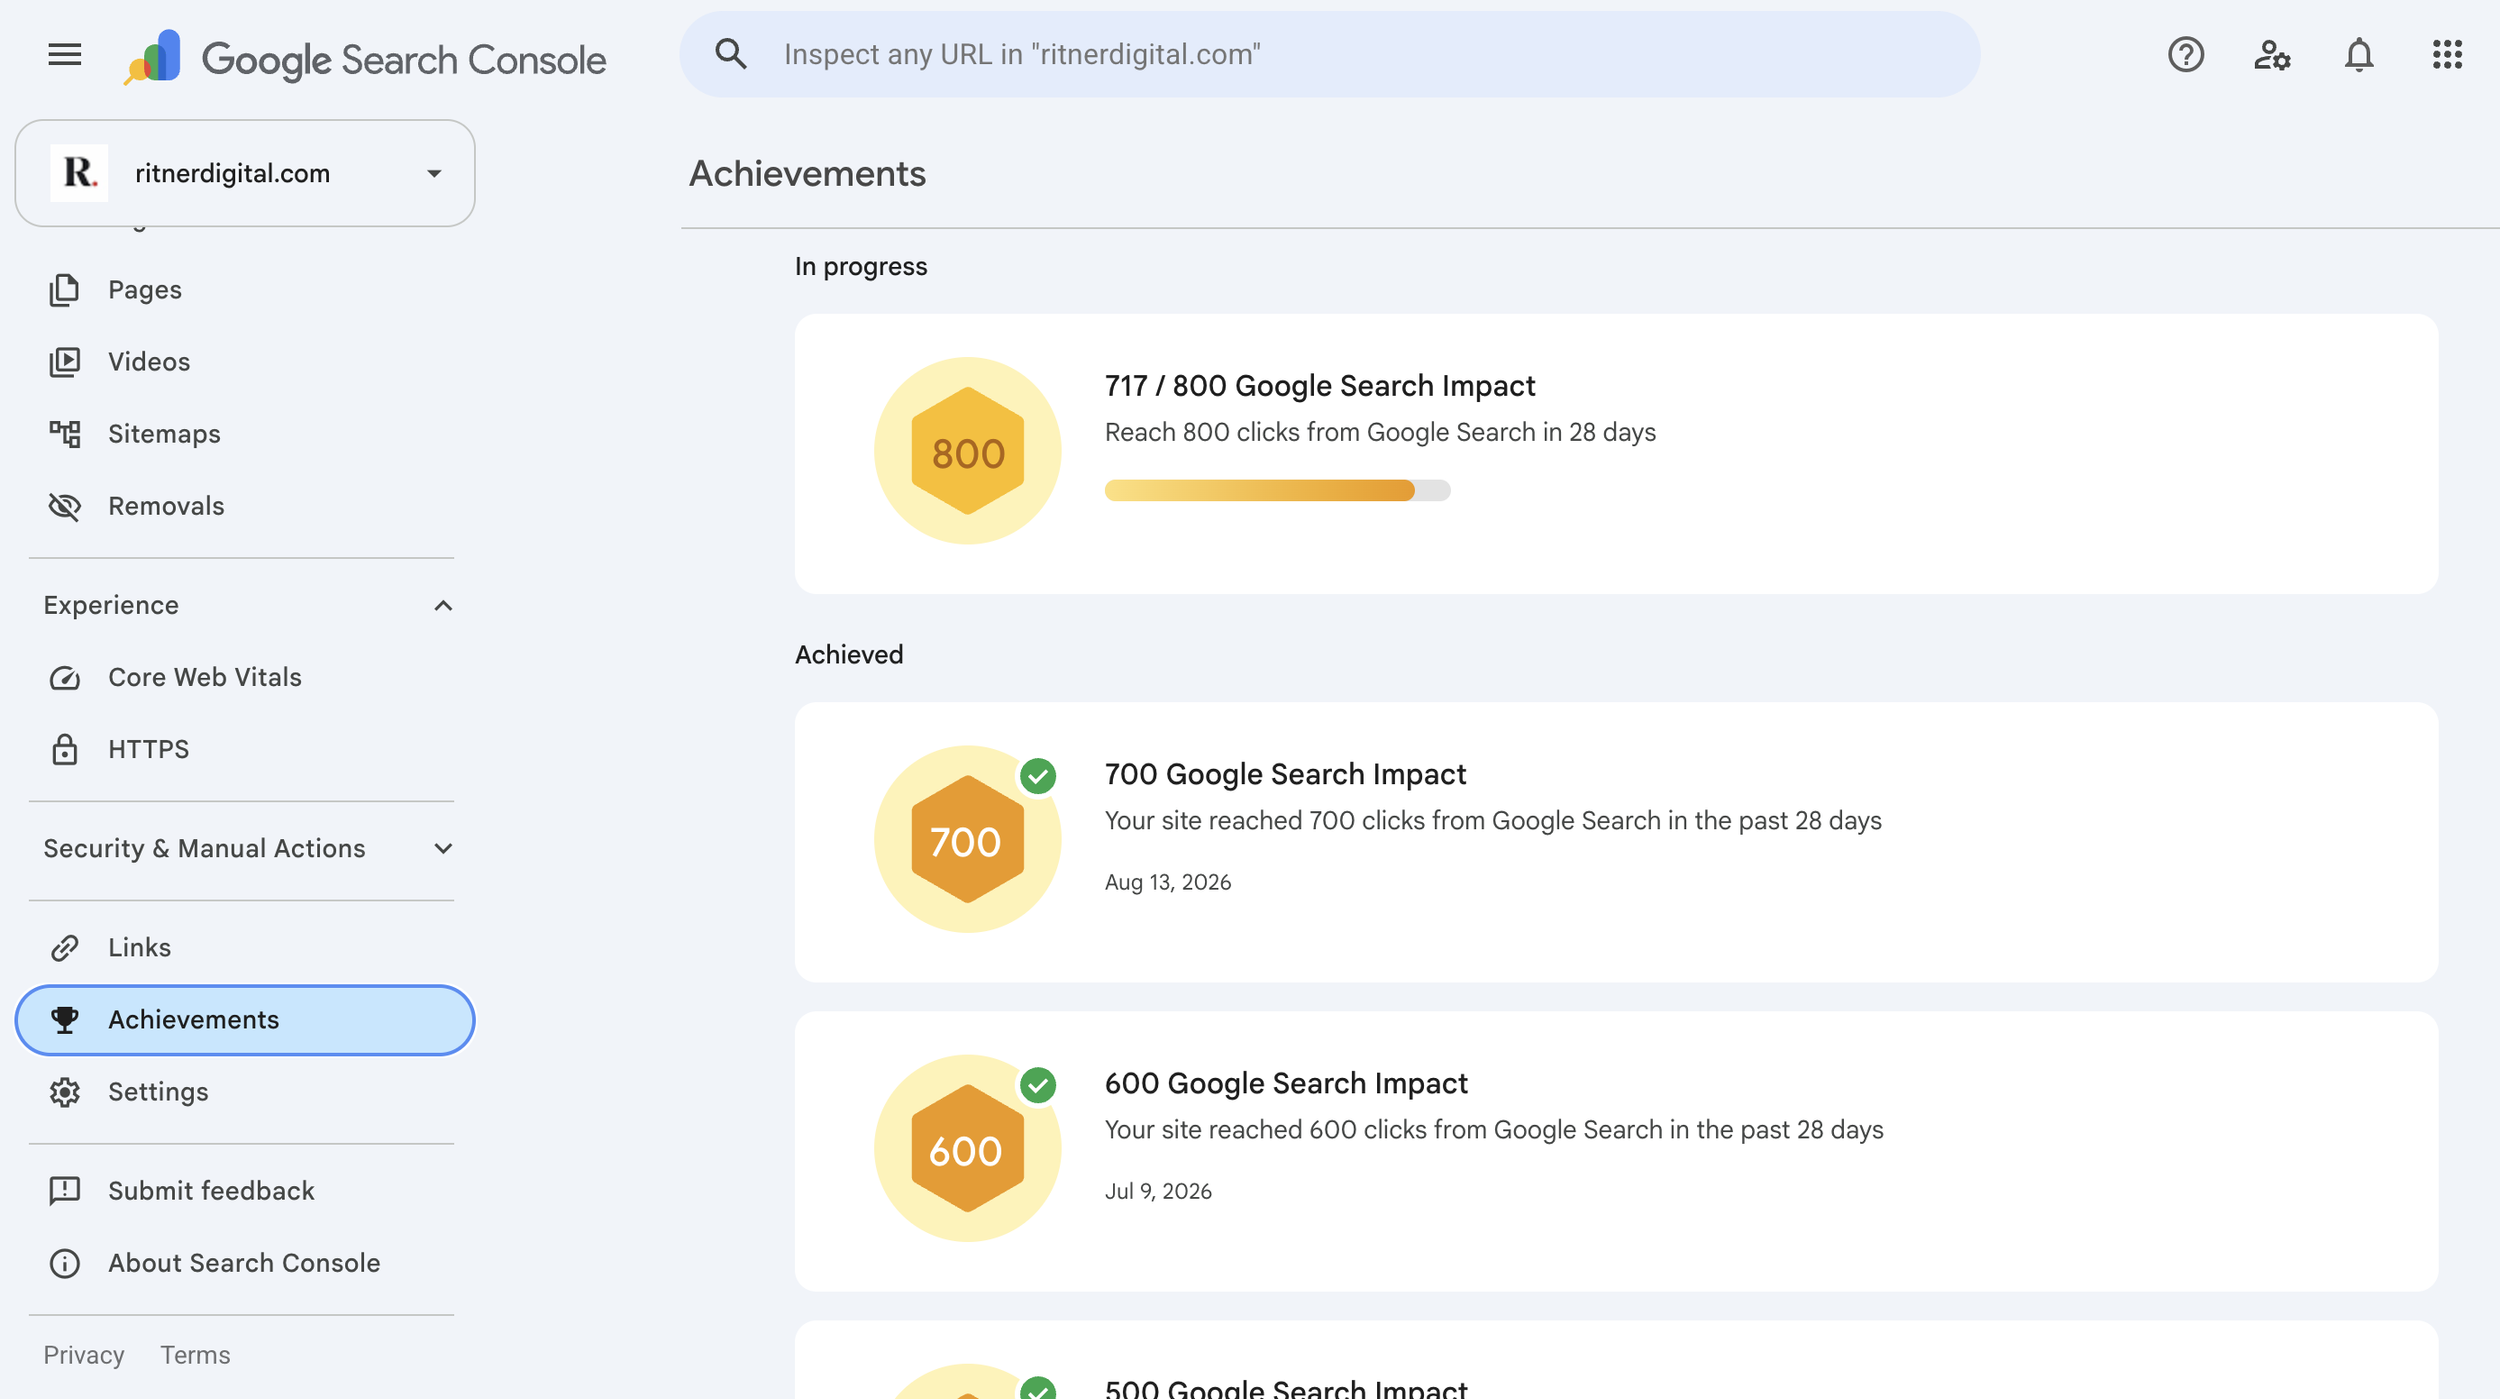
It shows one "In progress" goal at a time. The report has two sections — In progress and Achieved. Google automatically selects your next milestone based on your recent click data; you can't set custom targets. A site sitting at 40 clicks sees a 50-click goal; a site at 717 sees 800.
Each badge is shareable proof of progress. Clicking a milestone opens a celebratory card comparing your traffic to the prior 28 days, with links to the Insights report and improvement tips — genuinely useful for showing a boss, client, or skeptical business partner that the needle is moving.
It is not a ranking factor. Google is explicit that the feature is a motivational tracker and "wasn't designed to reflect how Google's ranking systems work" — badges don't influence your rankings, and a new property may need around 28 days of data before anything appears.
Where to find it: log in to Search Console, and look for Achievements in the sidebar. That's it. Now for the interesting part.
Our Actual Timeline: Every Milestone, Every Date
Here is our Achieved list, exactly as Search Console recorded it — the 28-day click milestones for ritnerdigital.com over roughly six months:
Read that middle column again, because the gaps are the whole story. From our first badge to our most recent is just under six months — and in that window, 28-day clicks grew 14x. But the growth was anything but even. It came in four distinct phases, and every site doing SEO honestly goes through versions of all four.
Phase 1: The Grind (Feb 18 – Apr 28 — 50 to 100 in 10 Weeks)
Look at the top of the table. Getting from 50 to 100 clicks — a mere 50-click improvement — took 69 days. Ten weeks to double from a small base. And notice that first gap: 33 days between the 50 and 60 badges. A month of work for ten more clicks.
This is the phase where most businesses quit, and it's worth being blunt about why the slowness is structural, not a sign of failure. In the early months, Google is still doing the unglamorous background work: crawling and indexing new pages, watching how searchers interact with them, and deciding how much to trust a site that hasn't earned much authority yet. Industry data backs the patience requirement — only about 5.7% of pages crack the top 10 results within their first year, and the pages that eventually win typically age into their rankings rather than debuting there.
What this phase is good for: building the inventory. Every service page, location page, and article published during the grind is a lottery ticket that hasn't been drawn yet. Which brings us to what happened next.
Phase 2: Traction (Apr 28 – Jun 7 — 100 to 200 in 6 Weeks)
The second doubling — 100 to 200 — took 40 days, nearly half the time of the first. Same site, same strategy, meaningfully faster results.
This is compounding starting to show its face. Content published in the winter had aged into rankings. Pages that ranked on page two crept onto page one, where the top results absorb the overwhelming majority of all clicks. Internal links between our service pages, industry pages, and blog posts started passing authority in a loop instead of a line. Nothing about the work changed. The inventory built during the grind simply started converting.
Phase 3: The Run (Jun 7 – Jun 28 — 200 to 500 in Three Weeks)
Now look at June. Between June 7 and June 28 — 21 days — the site went from 200 to 500 clicks per 28-day window. Milestones fell every two to four days: 250 on the 11th, 300 on the 15th, 350 on the 18th, 400 on the 22nd, 450 on the 24th, 500 on the 28th. From June 11 to June 28, the number doubled in 17 days.
To put that in perspective: the growth from 250 to 500 (a 250-click gain in two and a half weeks) is five times the total gain of the entire ten-week grind phase. This is what people mean when they say SEO compounds, and it's why judging an SEO program at month two is like judging an oven at minute two. The mechanism isn't magic — it's overlap. When multiple pages mature into ranking positions at once, when rankings lift click-through rates, when clicks and engagement reinforce the site's authority signals, the curves stack. In a single-team system where content, technical SEO, and site architecture are built to feed each other, the stacking is the design, not the luck.
Phase 4: The Breather (Jun 28 – Today — 500 to 717, With a Plateau)
And then — honesty time — the rocket eased off. 500 to 600 took a reasonable 11 days, but 600 to 700 took 35 days, the longest gap since the very first one. As of this writing we're at 717 of the 800-click goal.
We're including this phase deliberately, because a case study that ends at the vertical part of the curve is marketing, not education. Growth breathes. Several ordinary forces show up here: summer seasonality softens B2B search volume; the 28-day rolling window means a single strong week from June eventually rotates out of the math; and each new milestone is a bigger absolute number — going from 600 to 700 requires more new clicks than the entire first three months of the journey produced. A plateau after a run isn't the strategy failing. It's the base getting bigger. The response isn't panic; it's the same work that built the first curve — publishing, strengthening, earning authority — which sets up the next one.
What This Means If You're Staring at Your Own (Slower) Dashboard
A few honest takeaways from living this timeline, applicable to any site owner:
The first hundred clicks are the most expensive thing in SEO. They cost the most time per click by far. Everyone's chart looks like a flat disappointment right before it doesn't — and the sites that win are simply the ones still publishing when the compounding arrives.
Judge trajectory, not snapshots. Any single week of data lies in both directions. The Achievements report's real value is that it forces the long view: a dated, cumulative record that makes six months of progress visible in one screen — which is also exactly why it's such an effective client-reporting artifact.
Clicks are the middle of the funnel, not the end. A necessary caveat we'd give any client: Achievements tracks clicks only — not impressions, not conversions, not revenue. Seven hundred clicks that produce inquiries, booked calls, and customers is a business result; seven hundred clicks of drive-by traffic is a vanity metric. Every one of those clicks lands on your digital front door, and what happens next depends on whether the site is built to convert. Pair the Achievements timeline with your Performance report and your actual lead data before celebrating too hard.
And the milestones now undercount reality. One more 2026-specific note: Search Console measures clicks from Google Search — it doesn't capture the growing slice of discovery happening inside AI answers, where visibility comes from being cited by ChatGPT, Perplexity, and Google's AI Overviews. Some of that influence shows up in your data disguised as branded searches and direct visits. Your true visibility curve is steeper than any single report shows.
The Part Everyone Asks: Okay, But What Did You Actually Do?
No secret levers — the boring, coordinated fundamentals, executed relentlessly, which is rather the point. The working parts behind this specific curve: a technically clean site architecture built for crawling from day one; a steady publishing cadence of service pages, industry pages, location pages, and blog content each targeting real queries at every stage of intent; aggressive internal linking so every new piece strengthens the pages that matter commercially; and content structured to earn citations in AI search results alongside traditional rankings — the same clarity that wins a featured snippet wins a ChatGPT mention.
That's it. That's the playbook. The differentiator isn't a trick; it's that every channel was run by one team as one system, so the compounding phases arrived on schedule instead of never.
Frequently Asked Questions
What is the Achievements report in Google Search Console?
Achievements is a Search Console report, introduced by Google in September 2025, that tracks click-based milestones for your site — thresholds like 50, 100, 500, or 1,000 clicks from Google Search within a rolling 28-day window. It has two sections: In progress (the one milestone Google has selected as your next goal) and Achieved (a dated history of every milestone you've passed, often accompanied by a congratulatory email at the time). Each badge opens a shareable card comparing your traffic to the previous 28 days, with links to Insights and improvement tips.
Where do I find Achievements in Search Console?
Sign in at search.google.com/search-console, select your property, and look for Achievements in the left-hand sidebar navigation. Clicking any milestone opens its detail card. If you don't see the report or it's empty, the usual reasons are that the property is new — Google notes it can take roughly 28 days to accumulate enough data — or that search traffic is still too low for a milestone to be selected. Neither indicates a technical problem; keep building and the first badge (typically 50 clicks in 28 days) appears when the data supports it.
Do Search Console Achievements affect my rankings?
No. Google states directly that Achievements is a motivational tracker and wasn't designed to reflect how its ranking systems work. Badges are recognition of traffic you've already earned, not signals that influence future performance — reaching a milestone doesn't boost you, and a plateau between milestones doesn't penalize you. Their practical value is human: a dated, cumulative record of progress that's genuinely useful for motivation, stakeholder reporting, and (as this post demonstrates) understanding the shape of your growth curve over time.
How long does it take to grow from 50 to 500 clicks per month?
There's no universal timeline — it depends on your market's competitiveness, your content velocity, your site's technical health, and your starting authority. Our own documented run took about four and a half months from the 50-click badge (February 18) to the 500-click badge (June 28), but the growth was radically uneven: the first doubling took ten weeks while a later doubling took seventeen days. That shape — slow, then fast — is typical of compounding SEO. Treat any agency promising a fixed schedule with skepticism, and treat slow early months as the expected cost of the later acceleration.
Why did my SEO growth suddenly speed up (or stall)?
Both are normal phases of the same curve. Acceleration usually means accumulated content is maturing into rankings simultaneously — pages aging onto page one, internal links compounding authority, higher positions earning disproportionately more clicks. Stalls typically reflect bigger denominators (each milestone requires more absolute clicks than the last), seasonality in your market's search volume, the mechanics of the 28-day rolling window, or algorithm updates reshuffling results. Diagnose with the Performance report — compare queries and pages across periods — rather than reacting to the milestone pace alone.
Are clicks from Google Search the right metric to celebrate?
They're a legitimate leading indicator, but the middle of the story, not the end. Clicks measure people walking through your digital front door; they don't measure whether the site converted them into inquiries, bookings, or revenue — which Achievements doesn't track and which requires your analytics and CRM data. Clicks also undercount modern visibility, since influence from AI search citations often arrives disguised as branded or direct traffic. Celebrate the milestones, then verify them against leads and customers. Traffic that doesn't convert is a website problem wearing an SEO costume.
Can I set my own milestone goals in the Achievements report?
No — Google selects the single in-progress milestone automatically based on your recent click data, and you can't customize thresholds or add goals tied to your own business targets. That makes Achievements a progress tracker, not a planning tool. For real goal-setting, use the Performance report's query, page, and position data to define targets that map to revenue (rankings for specific commercial keywords, clicks to specific service pages), and let the Achievements badges serve as the celebratory mile markers they're designed to be along the way.
The Timeline Is the Testimonial
Six months. Fourteen-x growth in 28-day clicks. Ten slow weeks that felt like nothing, three explosive weeks that repaid all of them, and a breather that set up the next climb — every date stamped by Google, not by us. That's what SEO actually looks like from the inside, and it's why we'll keep showing our own dashboard: the shape of the curve is the most honest sales pitch there is.
If your Search Console has no badges yet — or one lonely 50-click badge from months ago — the diagnosis isn't that SEO doesn't work. It's that the compounding phases haven't been built yet. They're built the same way ours were: foundation, inventory, coordination, patience.
We'd love to build your timeline next. Ritner Digital runs the SEO, content, AI search visibility, and conversion-focused web design that turn a flat dashboard into a milestone streak — and we report on it with the same transparency you just read.
👉🏼 Get your free visibility audit and see where your curve starts →
Bring your Search Console. We'll show you exactly what's between you and your next badge.
Sources: Google Search Console Achievements documentation and our own Search Console property data (ritnerdigital.com, Feb–Aug 2026), Search Engine Journal, Stan Ventures, OnDigitals, Ahrefs search traffic study, Backlinko CTR research.