What Is Google Search Console Insights — And What Does Your Data Actually Mean?
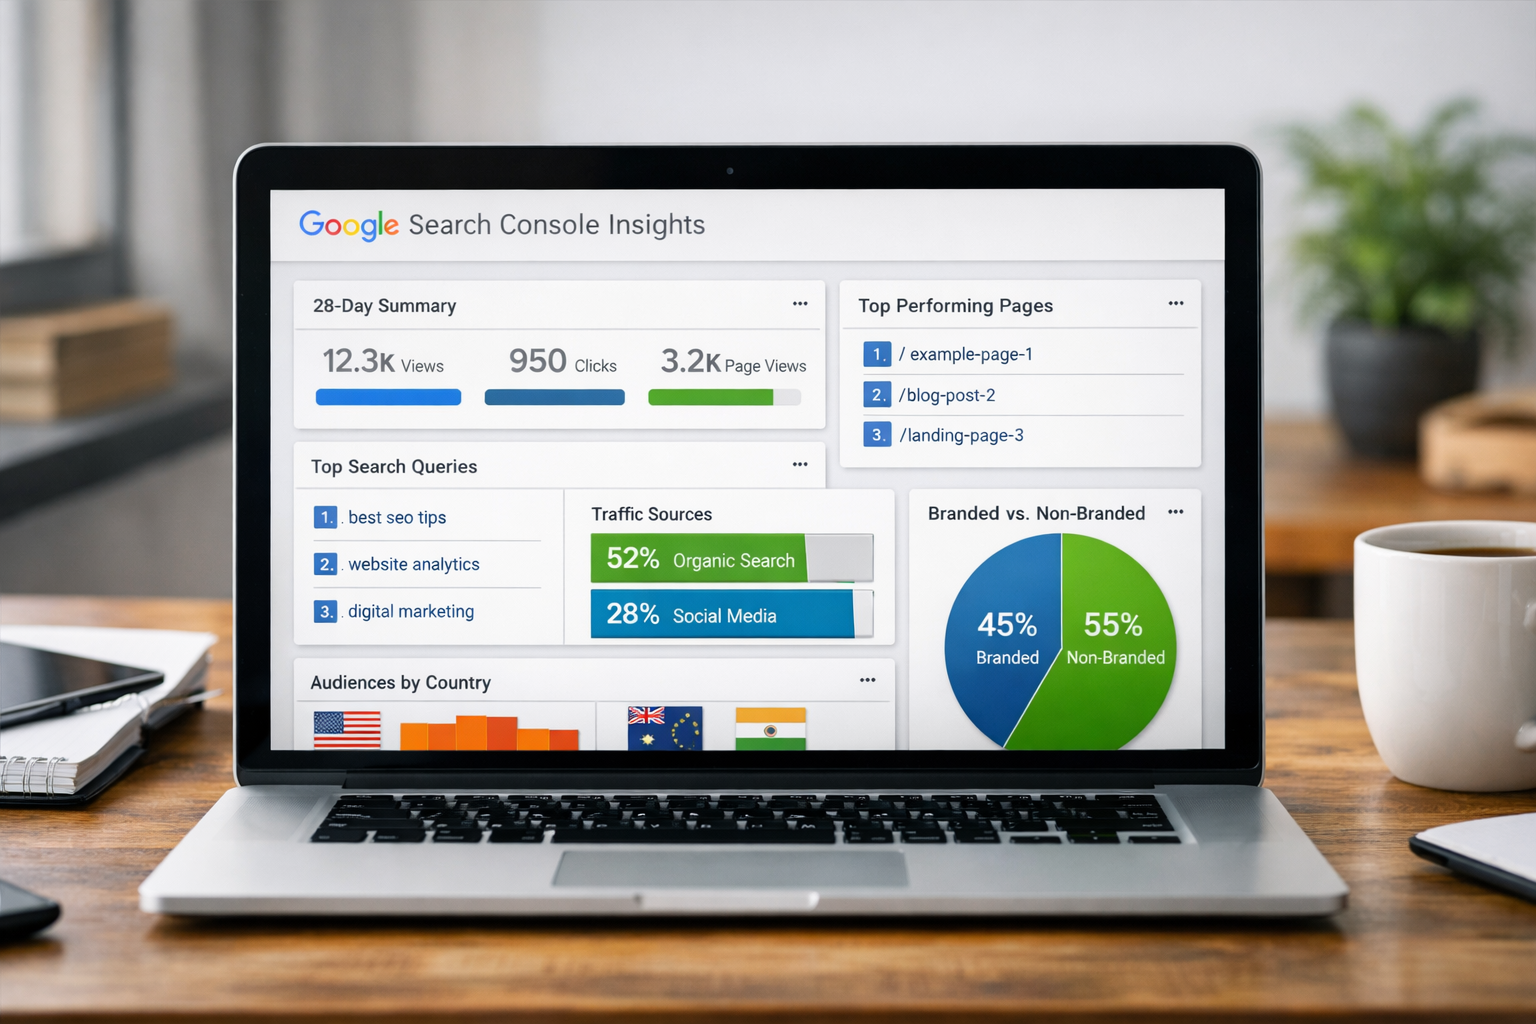
If you've ever logged into Google Search Console and clicked on the "Insights" tab, you've seen a dashboard that looks deceptively simple. A handful of numbers. A few top-performing pages. Some queries. A country breakdown. A branded versus non-branded traffic split.
It's easy to glance at it, feel vaguely good or vaguely concerned, and move on without extracting anything actionable from it.
That's a mistake — because Search Console Insights, read correctly, is one of the most honest performance reports your website produces. It tells you exactly how the internet is finding you, what content is resonating, where your search visibility is growing, and where the gaps are. It doesn't flatter you. It doesn't smooth over problems. It just shows you the data.
This post is going to walk through what Search Console Insights actually measures, what each section is telling you, and how to use our own 28-day data as a real-world example of what good growth looks like — and what questions it should prompt.
What Is Google Search Console Insights?
Google Search Console is the free tool Google provides to website owners that shows how their site performs in Google Search. It covers everything from which pages are indexed, to which keywords are generating impressions and clicks, to how the site performs on mobile and whether there are technical issues affecting search visibility.
Search Console Insights is a simplified, narrative layer on top of that raw data. Rather than requiring you to navigate multiple reports and cross-reference datasets manually, Insights surfaces the most important patterns from your last 28 days of search performance in a single, digestible view. It's designed to answer the questions that matter most to content creators, marketers, and business owners: What's working? What's growing? What's being found?
The 28-day window is intentional. It's long enough to smooth out day-to-day fluctuations and show meaningful trends, but short enough to reflect recent changes in content, search behavior, and ranking position. It's the right unit of time for understanding where your search presence stands right now — not where it was six months ago.
The Core Metrics: Clicks and Impressions
The two headline numbers in Search Console Insights are clicks and impressions, and understanding the relationship between them is foundational to reading any of the rest of the data correctly.
Impressions are how many times your website appeared in a Google search result during the 28-day window. Every time someone searched for something and your site showed up on the results page — whether they clicked or not — that counts as an impression. Impressions measure visibility. They tell you how often Google is deciding that your content is relevant enough to show to searchers.
Clicks are how many times someone actually clicked through to your site from a search result. Clicks measure traffic. They're the impressions that converted into an actual visit.
The ratio between the two — clicks divided by impressions — is your click-through rate, or CTR. A high impression count with a low click count means Google is showing your content but searchers aren't choosing it, which is typically a signal that either your title tags and meta descriptions aren't compelling enough, or that you're ranking for queries where searchers are satisfied by what they see in the search result without needing to visit the page.
Looking at our own 28-day data: 79 clicks and 51,000 impressions — and both numbers are growing significantly. Clicks are up 37% and impressions are up 71% compared to the prior period.
That growth pattern is worth understanding clearly. Impressions growing faster than clicks is completely normal at this stage of search visibility growth, and it's actually a healthy sign. It means Google is rapidly expanding the number of queries for which it's showing the site — broadening the footprint of search visibility significantly — while clicks grow at a more measured pace as ranking positions improve and CTR optimizes over time. A site that goes from low visibility to high visibility almost always sees impressions spike first, with clicks following as rankings mature and content earns higher positions on the results page.
The 71% impressions growth in a single 28-day window is a meaningful signal that content investment is translating directly into expanded search presence. That kind of trajectory, sustained over several months, is what eventually produces a significant organic traffic baseline.
Your Content: What the Top Pages Section Actually Tells You
The "Your Content" section shows which pages on your site are generating the most clicks from search — and more importantly, which pages are trending upward compared to the prior period. This is where Search Console Insights gets specific and actionable.
Looking at our own data, five pages generated notable click volume during the 28-day window, and all five showed upward trends from the previous period. Let's look at what each of them tells us.
The Google Search Console Zero Data post is the top performer by clicks, jumping from zero clicks in the prior period to 12. This is a textbook example of a topical, timely piece of content hitting a specific search need at exactly the right moment. When Google experienced a data reporting anomaly on March 18, 2026, a significant number of webmasters and marketers searched for an explanation. A piece of content that addressed that specific event, published quickly, captured that search demand and drove clicks that a generic evergreen post never would have. The lesson here is that timely, event-driven content targeting a specific search query can generate immediate traffic that evergreen content takes months to build.
The Ritner Digital homepage is generating 11 clicks, up 38% from the prior period. Homepage clicks from search are typically branded searches — people specifically looking for Ritner Digital by name. This is a direct measure of brand awareness and recall. When the homepage click count grows alongside non-branded content performance, it suggests that content discovery is creating brand awareness that converts into direct brand searches — the compounding effect of content marketing working as it should.
The Childhood Photo Carousel post, the Guard House Inn post, and the 100,000 Google Impressions post each generated clicks from zero in the prior period — meaning all three went from being invisible in search to generating actual traffic. This is the early stage of content gaining search traction, and it's a strong signal that these pieces are beginning to rank for relevant queries. The trajectory from zero clicks to initial clicks is often followed by accelerating growth as ranking positions improve over subsequent weeks.
The pattern across these five pages tells a coherent story: the site is generating clicks from a mix of timely event-driven content, evergreen educational content, and local/specific content — exactly the kind of diverse content portfolio that builds durable search visibility over time.
Queries Leading to Your Site: The Most Underrated Section
The queries section shows the specific search terms that brought people to your site. Most website owners glance at this and move on. That's leaving significant value on the table, because queries are the most direct window into what the market is actually looking for — and whether your content is positioned to capture it.
Looking at our own data, the top queries include "best marketing podcasts 2026," "guard house gladwyne," and "the guard house" — each jumping from zero clicks in the prior period to generating their first clicks now.
Each of these tells a specific story.
"Best marketing podcasts 2026" is a high-intent, competitive query that suggests a piece of content is beginning to rank for a category-level keyword in the marketing space. This type of query attracts a broad audience of marketing professionals — exactly the profile of potential client for a digital marketing agency. As this ranking matures and the content accumulates more authority, this single query has the potential to generate meaningful recurring traffic.
"Guard house gladwyne" and "the guard house" are local, specific queries indicating that the Guard House Inn blog post is capturing branded and location-specific search traffic for that topic. This is local SEO in action — content about a specific local business or place generating search visibility for the queries that potential visitors and customers would actually use. For businesses that serve local markets or work with local clients, this kind of content is one of the highest-value search strategies available.
The fact that all three of these queries are trending up from zero is significant. Zero-to-first-click is the most important transition in search visibility. It means Google has determined that the content is relevant enough to show for these queries — and from that starting position, consistent content quality and authority accumulation pushes rankings higher and clicks higher with them.
Branded vs. Non-Branded Traffic: The Ratio That Reveals Your Marketing Health
The branded versus non-branded traffic split is one of the most revealing metrics in Search Console Insights, and it's one that most businesses don't pay nearly enough attention to.
Branded traffic is clicks that came from searches that included your brand name — people searching specifically for you. Non-branded traffic is clicks from searches for topics, questions, or keywords where your brand wasn't part of the query — people who found you without looking for you specifically.
Our own data shows 13% branded and 87% non-branded traffic.
This ratio tells a very positive story. For a growing business, a high proportion of non-branded traffic means that content and SEO investment is working — that the site is being discovered by people who didn't already know about the brand. Non-branded traffic is how you grow your audience. Branded traffic is how you measure your existing brand awareness.
A site with 90% branded traffic and 10% non-branded is essentially only being found by people who already know it exists. That's a ceiling on growth — because the pool of people who already know your brand is finite. A site with 87% non-branded traffic is actively expanding its audience through organic discovery, which is the compounding dynamic that makes content marketing one of the highest-ROI marketing investments over time.
The ideal trajectory for a growing business is to sustain high non-branded traffic — evidence that organic discovery is working — while watching branded traffic grow in absolute terms as the expanding non-branded audience converts into brand awareness and recall. Both numbers growing simultaneously is the signature of a content strategy that's compounding correctly.
Top Countries: What Your Geographic Distribution Means
The country breakdown in Search Console Insights shows where in the world your clicks are coming from. For a locally-focused business, this data helps confirm that your content is reaching the right geographic audience. For a business with broader ambitions, it reveals which markets are discovering you organically.
Our own data shows 58% United States, 13% United Kingdom, 5% India, 3% Australia, and 3% Greece.
The US dominance is expected and healthy for a US-based marketing agency. The UK percentage is notable — 13% of clicks from the United Kingdom suggests that either some content topics have broad enough appeal to reach English-speaking international audiences, or that specific pieces of content are ranking for queries with international search volume. For a business that serves or wants to serve UK clients, this is a valuable signal. For a business that's exclusively US-focused, it's a useful reminder that search is inherently global and that geographic targeting in content and paid strategy can help concentrate visibility where it matters most.
The smaller percentages from India, Australia, and Greece are typical of a site with growing international search visibility — early signs of global discovery that will shift in distribution as content strategy becomes more or less intentionally international over time.
Additional Traffic Sources: The Image Search Signal
A single click from image search might seem too small to mention. It isn't — it's worth paying attention to for what it signals about content opportunity.
Image search is an entirely separate discovery channel from web search, and most businesses invest almost nothing in optimizing for it. Images with descriptive, keyword-rich file names and alt text rank in Google Image Search and can generate traffic from users who are searching visually rather than textually. For businesses that produce visual content — infographics, data visualizations, photography, product images, brand assets — image search represents a meaningful and often entirely untapped traffic opportunity.
One image search click in a 28-day window is not a significant traffic driver. But it's a signal that the site's images are beginning to appear in image search results — and that investing in proper image SEO, descriptive file naming, and alt text optimization across the entire content library could meaningfully expand this channel over time.
Reading the Full Picture: What 28 Days of Data Is Actually Saying
Stepping back from the individual metrics and reading the data as a whole, our 28-day Search Console Insights snapshot is telling a clear and coherent story.
Impressions are growing at 71% — the search footprint is expanding rapidly, meaning Google is showing the site for a significantly wider range of queries than it was a month ago. Clicks are growing at 37% — actual traffic is following the impressions growth at a healthy pace. Multiple pages that had zero clicks in the prior period are now generating their first clicks — the content portfolio is broadening its search traction. The non-branded traffic ratio is 87% — organic discovery is working, and new audiences are finding the site through content rather than through brand recognition alone. Queries are diversifying — from timely event-driven content to local content to category-level marketing queries, the site is appearing in a wider range of search contexts.
This is what healthy early-stage search growth looks like. The next phase — moving from initial click generation to consistent ranking in top positions for meaningful queries — requires the same consistent investment that produced this 28-day snapshot, sustained over the next several months. Search compounding is real, and the businesses that sustain it are the ones whose organic traffic becomes a reliable, self-reinforcing source of leads rather than a fluctuating function of paid spend.
How to Use This Data in Your Own Business
Search Console Insights is available to every business with a verified website in Google Search Console — which is free. If you're not checking it regularly, you're flying blind on one of the most important performance signals your website produces.
The cadence that works best for most businesses is a monthly review of the 28-day window, looking specifically for three things: which pages are generating new clicks for the first time, which queries are driving traffic and whether those queries match the audience you're trying to reach, and how the branded-to-non-branded ratio is shifting over time. Those three data points, tracked consistently, tell you more about the health of your content and search strategy than almost any other report.
If what you're seeing in Search Console Insights is flat impressions, declining clicks, a high branded-to-non-branded ratio, or queries that don't match your target buyer — those are not abstract problems. They are specific, fixable gaps in your digital marketing strategy, and they have specific solutions.
At Ritner Digital, we help businesses understand what their data is actually saying — and build the content and SEO strategy that turns search visibility into a consistent source of leads and growth. If your Search Console data isn't trending in the right direction, let's talk.
Frequently Asked Questions
What is the difference between Google Search Console and Google Search Console Insights?
Google Search Console is the full platform — a comprehensive suite of reports covering everything from which pages are indexed, to keyword performance, to technical site health, to mobile usability. It's powerful but requires some familiarity with SEO concepts to navigate effectively. Search Console Insights is a simplified, narrative summary layer built on top of that data, designed to surface the most important patterns from the last 28 days in a single readable view. Think of Search Console as the full dataset and Insights as the curated highlight reel. For business owners and marketers who want a quick, clear read on how their content is performing in search without digging through multiple reports, Insights is the right starting point. For deeper analysis — understanding which specific keywords are ranking at which positions, identifying technical issues, or diagnosing traffic drops — the full Search Console reports are where that work happens.
How often should I be checking Search Console Insights?
For most businesses, a monthly review is the right cadence. The 28-day window that Insights uses is designed to show meaningful trends rather than day-to-day fluctuations, so checking more frequently than monthly doesn't typically reveal new information that would change your strategy. The monthly review should focus on three specific questions: which pages generated clicks for the first time this period, which queries are driving traffic and whether they match the audience you're trying to reach, and how the branded-to-non-branded traffic ratio is shifting. Those three data points, tracked consistently over time, give you a clear and honest picture of whether your content and search strategy is working. If you're actively publishing new content or making significant changes to your site, checking every two weeks can help you understand more quickly which new pieces are gaining traction.
What is a good click-through rate from impressions to clicks in Google Search?
Click-through rate — the percentage of impressions that result in a click — varies significantly by ranking position, query type, and industry. As a general benchmark, pages ranking in position one on Google see average CTRs in the range of 25–35%. Pages in positions two through five typically see CTRs between 8–15%. Pages ranking below position ten — on the second page of results — typically see CTRs below 2%. This is why ranking position matters so much: the difference in traffic between ranking first and ranking fifth for the same query can be ten times or more. For a site with a high impression count and a low click count, the most likely explanation is that most impressions are coming from queries where the site ranks in positions five through twenty — visible enough for Google to show, but not prominent enough to win the click consistently. Improving that CTR requires either improving ranking positions through SEO investment, or improving the title tags and meta descriptions that appear in search results so that they're more compelling to click when the site does appear.
What does it mean when a page goes from zero clicks to its first clicks in Search Console?
The zero-to-first-click transition is one of the most important signals in Search Console, and it's one that most businesses underweight. When a page goes from zero clicks in one period to generating its first clicks in the next, it means Google has determined that the content is relevant and authoritative enough to begin showing it for specific queries — and that at least some of the people who saw it in search results decided it was worth clicking. This is the beginning of a ranking trajectory that, with consistent content quality and site authority, typically continues upward over subsequent months. A page that generates two clicks in month one might generate ten in month three and fifty in month six as ranking positions improve and the page accumulates more authority. The practical implication is that new content should not be evaluated on whether it's driving traffic in the first few weeks after publication. The right evaluation window is three to six months, which is typically how long it takes for a new piece of content to move from initial indexing through to stable, meaningful ranking positions.
What does an 87% non-branded traffic ratio mean, and is that good?
Non-branded traffic is traffic that came from searches that didn't include your brand name — people who found you by searching for a topic, question, or keyword rather than searching for you specifically. An 87% non-branded ratio means that the overwhelming majority of search traffic is coming from organic discovery rather than from people who already know your brand exists. For a growing business, this is an excellent signal. It means content and SEO investment is actively expanding the audience — reaching people who have never heard of the brand before and bringing them into the site through relevant, discoverable content. A business with a very high branded traffic ratio — say, 80% branded, 20% non-branded — is essentially only being found by people who already know it. That's a ceiling on organic growth. A business with 87% non-branded traffic has a far more scalable organic discovery engine. The ideal trajectory is to watch non-branded traffic grow in absolute terms while branded traffic also grows — because as new audiences discover the brand through non-branded content, some of them will come back later and search for it by name, gradually increasing branded volume as well.
Why are my impressions growing much faster than my clicks, and should I be concerned?
Impressions growing faster than clicks is one of the most commonly misread signals in Search Console, and it almost never indicates a problem at early to mid stages of SEO growth. When a site is expanding its search footprint — publishing more content, earning more authority, ranking for more queries — impressions spike first because Google begins showing the site for a wider range of searches. Clicks follow more slowly because they're gated by ranking position: a site that jumps from ranking twentieth to ranking twelfth for a given query will see a big impressions increase but a modest click increase, because position twelve still doesn't generate significant CTR. As ranking positions mature and move into the top five for the most relevant queries, clicks accelerate and the ratio between impressions and clicks normalizes. In the meantime, rapidly growing impressions with more modest click growth is exactly the pattern you want to see — it means the search footprint is expanding, and the clicks will follow as positions improve. The time to be concerned about the impressions-to-clicks ratio is if impressions are flat or declining, or if clicks are declining even as impressions hold steady — both of which can indicate ranking drops or CTR issues that warrant investigation.
What should I do if the queries driving traffic to my site don't match my target audience?
Query mismatch — where Search Console shows traffic coming from searches that don't reflect the audience you're trying to reach — is one of the most useful diagnostic signals the platform provides, and it's a problem that has a specific solution. If your site is ranking for queries that don't match your ideal buyer, it typically means one of three things: the content on the site is optimized for topics that aren't closely aligned with the problems your target buyer is searching for, the site has accumulated authority in a topic area adjacent to but distinct from your core offering, or the content is serving a broad audience when it should be serving a specific one. The solution in all three cases is the same: create content that is explicitly targeted at the queries your ideal buyer is actually using when they're looking for what you offer. That means starting with buyer research — understanding what questions, problems, and keywords your target customer searches for — and building a content strategy around those specific queries rather than around topics that feel relevant but aren't mapped to actual buyer search behavior. Search Console Insights is showing you the gap. Content strategy is how you close it.
How does Search Console Insights data connect to lead generation and business growth?
The connection is direct, though it operates through a chain of cause and effect that unfolds over months rather than days. Growing impressions mean Google is showing your site to more people searching for relevant topics — that's expanding reach. Growing clicks mean more of those people are visiting your site — that's expanding traffic. A high non-branded traffic ratio means new audiences are discovering your brand through content — that's expanding brand awareness among people who didn't know you existed. Pages generating their first clicks from specific queries mean your content is beginning to rank for the searches your target buyers are actually performing — that's the foundation of inbound lead generation. The businesses that track these signals consistently and invest in the content and SEO work that moves them in the right direction are the ones that, 12 to 18 months from now, have a meaningful organic traffic baseline generating a consistent flow of inbound leads that doesn't depend entirely on paid advertising spend. Search Console Insights is the instrument panel for that journey. The businesses that read it regularly and act on what it's telling them are the ones that compound organic growth into a durable competitive advantage.