What a Real AI Marketing Dashboard Looks Like vs a Basic One
Most marketing teams have dashboards. They've had them for years. There's the Google Analytics tab that's always open, the Meta Ads Manager bookmark, the Google Ads performance view, probably a Looker Studio report someone built eighteen months ago that half the team stopped trusting. Maybe a spreadsheet pulling it all together that takes someone three hours to update every Monday morning.
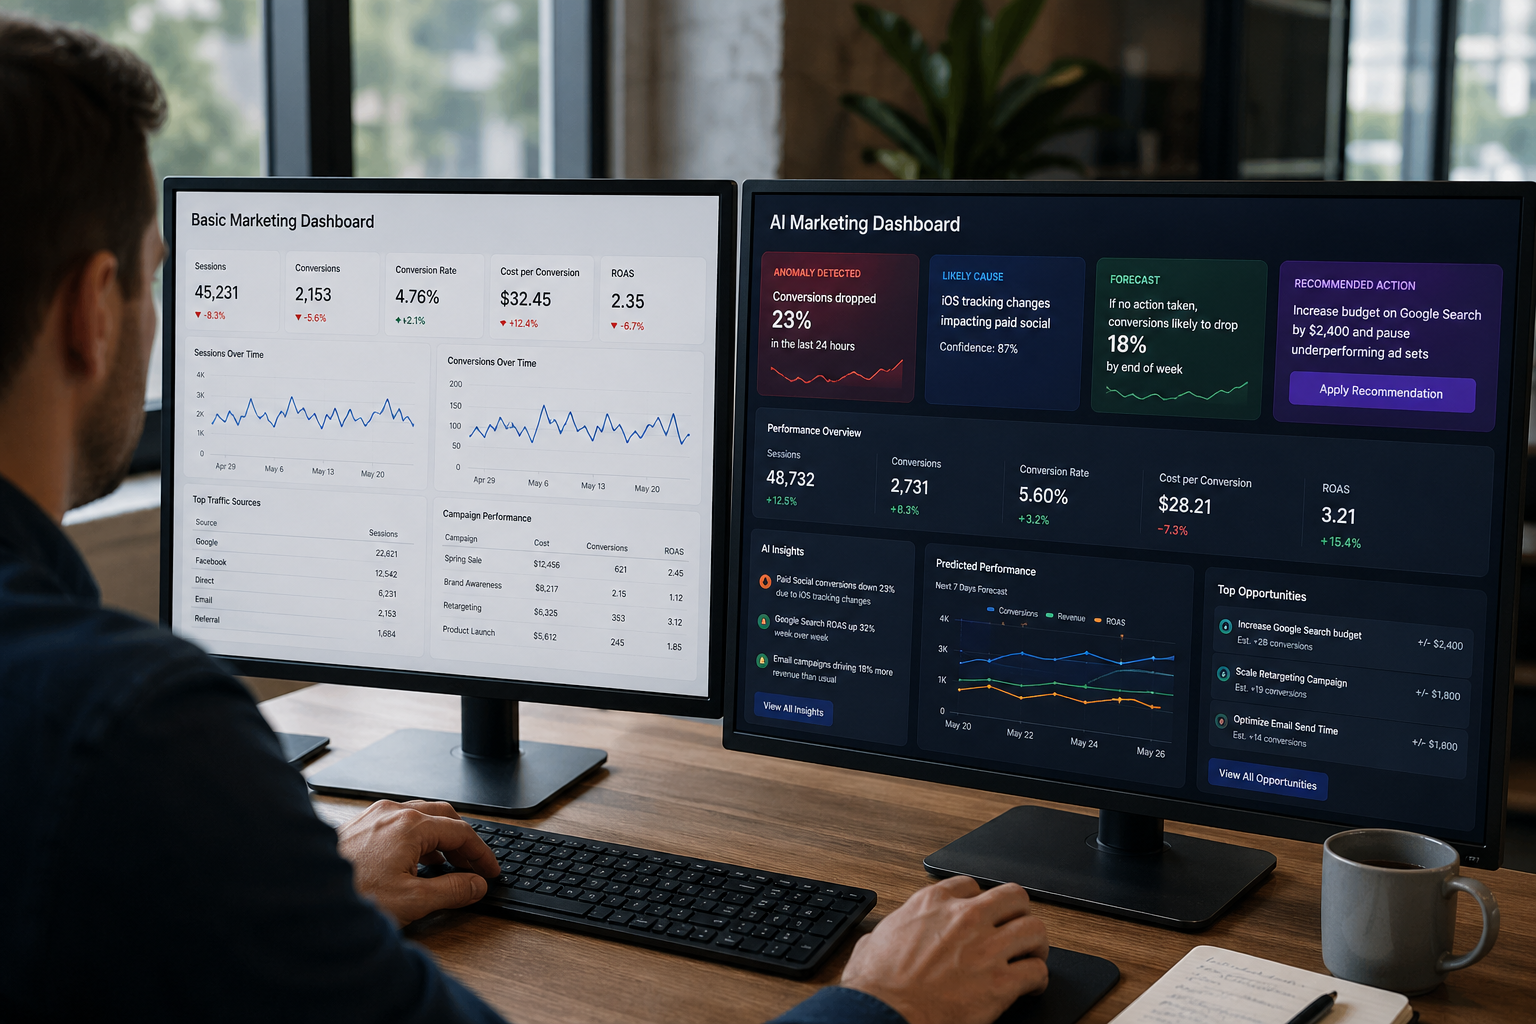
That is a basic marketing dashboard setup. And the word "basic" isn't meant as an insult — it accurately describes what these tools do. They display what happened. They show you numbers from the past. They require a human to interpret them, identify the problem, figure out the cause, and decide what to do.
An AI marketing dashboard does something fundamentally different. It doesn't just show you data — it tells you what the data means, flags what requires your attention, predicts what's likely to happen next, and in increasingly sophisticated implementations, recommends or even executes the action. The difference between the two isn't cosmetic. It's a difference in how your team spends its time and how quickly your marketing improves.
What a Basic Marketing Dashboard Actually Does
To understand the gap, start with a clear-eyed picture of what basic dashboards provide.
A basic marketing dashboard is a data visualization tool. It pulls numbers from one or more data sources and displays them in charts, graphs, and tables. You can see traffic over time, campaign impressions, click-through rates, conversions, cost per acquisition, return on ad spend. You can filter by date range, segment by channel, and compare periods.
This is genuinely useful. Having your metrics in one place is better than having them scattered across five different platform tabs. Visualization helps identify trends that raw numbers obscure. Dashboards reduce the amount of time spent pulling reports manually — at least in theory.
The limitations of basic dashboards reveal themselves in three consistent patterns.
Here's the problem with traditional BI dashboards: they're built to look backward, not help you move forward. By the time you get your report, the market has already shifted. ThoughtSpot
They're reactive, not proactive. A basic dashboard shows you that conversion rate dropped 18% last week — after the week is over, after the budget has already been spent, after the campaign has already underperformed. You're always responding to history rather than influencing outcomes.
They require human interpretation at every step. The dashboard shows the numbers. A human has to decide which numbers matter, figure out what changed, determine why it changed, decide what to do about it, and execute the change. That chain of events takes time — often more time than the window of opportunity it's responding to.
They fragment rather than unify. Marketing teams drown in dashboards. Google Analytics shows one story, Google Ads another, and Meta Ads a third. Teams spend hours each week exporting CSVs, reconciling numbers, and explaining why totals don't match. Improvado The basic dashboard solves the visualization problem without solving the fragmentation problem — because each platform is still telling its own story.
What an AI Marketing Dashboard Actually Does
An AI marketing dashboard starts from the same place — pulling data from your marketing channels — but what it does with that data is categorically different.
AI dashboards use machine learning to automatically detect anomalies, predict trends, and surface insights that would take analysts days to find manually. AI features like anomaly detection flag issues such as statistically significant drops in conversion rates for campaigns. Improvado
The operational shift is from you finding the insight to the system surfacing it for you. Instead of spending thirty minutes reviewing reports to notice that one campaign's cost per lead spiked on Tuesday, the AI flags it the moment the spike becomes statistically significant — and tells you what likely caused it.
The AI watches your metrics over time and flags unusual movement. If conversion rate drops 23% unexpectedly, the dashboard alerts you. If CPL spikes during a normally stable period, you see it immediately. You're no longer reviewing spreadsheets row by row looking for problems. The system finds them first. Matz Analytics
That shift — from you looking for problems to the system finding them and bringing them to you — changes how marketing teams operate. Instead of spending time in data archaeology, they spend time making decisions.
The Specific Features That Separate AI Dashboards From Basic Ones
Unified Data With Automatic Normalization
Basic dashboards pull from multiple sources but often leave the reconciliation problem to the human. Numbers from different platforms use different definitions, different attribution windows, and different time zones. The analyst has to sort it out.
AI dashboards solve this at the infrastructure layer. The best AI dashboards for marketing integrate 500+ data sources natively — including Google Ads, Meta, LinkedIn, Salesforce, and HubSpot — eliminating the need for manual data pipelines or third-party connectors. Improvado They normalize campaign names, currencies, attribution models, and time zones automatically so that when you see a number, it means the same thing regardless of which platform it came from.
Gartner estimates that poor data quality costs businesses an average of $12.9 million a year per company. If a dashboard cannot normalize campaign names, currencies, and time zones automatically, you will pay for it in both dollars and credibility. Funnel
Anomaly Detection and Proactive Alerts
This is one of the clearest differentiators between a basic dashboard and an AI-powered one. A basic dashboard will show you that something went wrong when you look at it. An AI dashboard tells you something went wrong when it happens.
Instead of writing "Conversions increased 12% month-over-month," the dashboard generates contextual explanations: "Conversions increased 12% this month, primarily driven by an 18% lift in high-intent keywords after the bid adjustment — suggesting the strategy change is working." Matz Analytics The AI doesn't just quantify the change — it contextualizes it, connecting the metric movement to the likely cause.
This is the difference between a report that tells you what happened and an intelligent system that tells you why.
Predictive Analytics and Forecasting
Basic dashboards show you the past. AI dashboards show you the likely future.
Real-time data processing gives you instant insights from live, streaming data. This means you can see the impact of a new marketing campaign as it happens, not days or weeks later when the information is already stale. ThoughtSpot
Beyond real-time reporting, AI dashboards use historical behavioral patterns to forecast future performance — predicting campaign results before they fully materialize, flagging budget pacing issues before they become overspend problems, and identifying seasonal trends early enough to act on them rather than react to them.
AI elevates dashboards beyond reporting: predictive analytics, anomaly detection, and automated insights help you spot risks early, optimize campaigns faster, and allocate resources with greater confidence. Monday.com
Natural Language Querying
One of the most practically useful features of modern AI dashboards — and one of the clearest illustrations of how far they've moved from basic reporting tools — is the ability to ask questions in plain English and receive immediate answers.
Conversational analytics lets you have a real back-and-forth dialogue with your data. You can ask "What were our top products last quarter?" and then follow up with "Why did Product X decline?" to get a detailed breakdown of contributing factors without starting over. ThoughtSpot
AI Chat lets you ask questions about your marketing data in plain English and get instant analysis without building complex reports. Cometly The practical implication is that insights are no longer gated by the ability to build reports or write SQL queries. A marketing manager can ask "Which campaigns drove the most revenue last month and what did they have in common?" and receive an answer in seconds rather than waiting two weeks for the data team to produce an analysis.
Actionable Recommendations — Not Just Insight
The most advanced AI marketing dashboards don't stop at surfacing insights. They recommend what to do about them — and in some cases, execute those recommendations automatically.
The AI Ads Manager goes beyond reporting by analyzing data and delivering specific optimization recommendations. It identifies which ads and campaigns are actually converting across every channel, then suggests where to scale spend with confidence. Cometly
This is the category distinction that matters most for business outcomes. A basic dashboard tells you your CPL is up 34%. An AI dashboard tells you your CPL is up 34%, identifies that the increase is concentrated in one audience segment that is showing declining engagement, recommends pausing that segment and reallocating that budget to the two highest-performing segments, and shows you the projected impact of doing so.
One produces a number to report. The other produces a decision to make.
What the Gap Looks Like in Real Terms
The practical difference between a basic marketing dashboard and an AI-powered one isn't abstract. It shows up in concrete, measurable ways in how teams operate.
The best AI marketing analytics tools save teams 10+ hours per week by bringing all marketing data in one place, keeping data accurate and consistent, surfacing key metrics without digging through lengthy reports, and supporting proactive monitoring rather than reactive responses. Madgicx
Ten hours a week is the time currently spent pulling reports, reconciling numbers across platforms, building manual analyses, and writing narrative summaries of what the data shows. That's time redirected from reporting to decision-making — which is where marketing teams actually create value.
The accuracy dimension matters as much as the efficiency dimension. A dashboard on its own is no longer enough. The winners will be platforms that combine AI, predictive insight, privacy safeguards, and clean data foundations in one place. Funnel
Marketing decisions made on inaccurate data — from fragmented attribution, mismatched definitions, or stale numbers that haven't been updated since Tuesday — systematically misdirect budget. The cost of bad data compounds over every campaign cycle. AI dashboards reduce that error rate by solving the data quality problem at the source rather than leaving it to the analyst to catch.
The Progression: Where Most Businesses Are and Where They Should Be Going
Very few businesses should or need to jump immediately to the most sophisticated AI dashboard implementations. The progression is practical.
Stage 1 — Centralized visibility. All your channels reporting into a single dashboard so you're not reconciling numbers across five different platform tabs. This alone eliminates significant manual work and improves decision-making simply by ensuring everyone is looking at the same data.
Stage 2 — Automated reporting and alerts. Dashboards update automatically, alerts notify the team when metrics move significantly, and weekly reporting no longer requires a human to pull and compile data. The team receives information rather than going to retrieve it.
Stage 3 — Anomaly detection and context. The system not only flags when something changes but provides context about likely causes and connections to other metrics. Insights surface without being sought.
Stage 4 — Predictive and prescriptive intelligence. The dashboard forecasts future performance, recommends specific actions based on current data, and in the most advanced implementations, executes optimizations automatically within defined parameters.
Most businesses with functional digital marketing operations are operating at Stage 1 or somewhere between Stage 1 and Stage 2. The gap between where they are and where an AI dashboard would take them is significant — and closing it doesn't require starting from scratch. It requires connecting existing data sources to a more intelligent system and shifting from manual interpretation to AI-assisted decision-making.
The Question That Drives the Upgrade
Here is the simplest way to assess whether your current marketing dashboard is limiting your results: how much of your team's time is spent preparing and interpreting data versus making decisions and executing changes?
If the answer is that more time goes into the reporting process than the decision process, the dashboard is a bottleneck rather than an asset. The best AI marketing analytics tools help by bringing all your marketing data in one place, keeping data accurate and consistent, surfacing key metrics without having to dig through lengthy reports, and supporting proactive monitoring rather than reactive responses so issues are caught early instead of after the fact. Whatagraph
The goal isn't a more beautiful dashboard. It's a system that surfaces the right information at the right time, tells you what it means, and points toward what to do about it — so that the marketing team's time goes into the work that actually moves the numbers.
Want to replace your fragmented reporting setup with a marketing intelligence system that tells you what's actually happening and what to do about it?
Let's talk at ritnerdigital.com/#contact
Ritner Digital is a digital marketing agency helping businesses build, grow, and optimize their online presence with strategy-first thinking and data-backed execution.
Frequently Asked Questions
What is the main difference between a basic marketing dashboard and an AI marketing dashboard?
A basic marketing dashboard is a visualization tool — it displays historical data from your marketing channels in charts and graphs so you can see what happened. You still have to look at it, interpret it, identify what matters, figure out what caused it, and decide what to do. An AI marketing dashboard is an intelligence layer — it actively monitors your data, flags anomalies when they occur, explains likely causes, predicts future performance, and recommends specific actions. The practical difference is the direction information flows. With a basic dashboard, you go looking for insight. With an AI dashboard, insight comes to you. One is a reporting tool. The other is a decision-support system.
Do I need to be a data analyst or have technical skills to use an AI marketing dashboard?
No, and removing the technical barrier is one of the core value propositions of modern AI dashboards. Natural language querying — the ability to ask questions in plain English and receive immediate answers — means you don't need to know how to build reports, write SQL queries, or understand data architecture to get useful insights. You can ask "Which campaigns drove the most qualified leads last month and what did they cost?" and receive a direct answer with the relevant context. The data team still plays an important role in setup, governance, and advanced analysis, but day-to-day access to marketing intelligence no longer requires waiting on analysts to build reports for you.
How does anomaly detection in an AI dashboard actually work?
Anomaly detection uses machine learning to establish what normal looks like for each metric in your marketing data — accounting for day-of-week patterns, seasonal trends, and typical variance ranges. When a metric moves outside of what the model predicts as normal, the system flags it as an anomaly and alerts you. The AI then looks for correlations with other metrics to generate a likely explanation — for example, flagging that a spike in cost-per-lead coincides with a specific campaign's budget increase and a drop in its quality score. The result is that you don't need to review every metric every day looking for problems. The system monitors continuously and brings the exceptions to your attention, with context about what likely caused them.
Can an AI dashboard pull from all my different marketing platforms — Google, Meta, LinkedIn, email, CRM?
Yes, and unified data ingestion across all channels is one of the foundational capabilities of AI marketing dashboards. Modern platforms connect natively to the major ad platforms, analytics tools, CRM systems, and email platforms — pulling data automatically without manual exports or CSV reconciliation. The more important capability is normalization: ensuring that metrics from different platforms use consistent definitions, attribution windows, and time zones so comparisons across channels are actually meaningful. Without normalization, a unified dashboard still leaves you reconciling discrepancies manually. With it, you get a single source of truth where every number means the same thing regardless of which platform generated it.
What is natural language querying and why does it matter for marketing teams?
Natural language querying is the ability to ask your data questions the same way you'd ask a colleague — in plain conversational English — and receive immediate, specific answers. Instead of building a report to find out which ad creative drove the lowest cost per conversion last quarter, you ask the question directly and get the answer in seconds. This matters because marketing insights are currently gated by the technical complexity of extracting them. If getting an answer requires a data analyst to build a custom report, many questions simply don't get asked — which means decisions get made on incomplete information. Natural language querying removes that gate, giving every member of the marketing team direct access to the insights they need without depending on technical resources for routine analysis.
How is predictive analytics different from standard reporting in a dashboard?
Standard reporting shows you what happened — impressions, clicks, conversions, costs over a period of time. Predictive analytics uses historical patterns and current behavioral signals to forecast what is likely to happen. In a marketing context this means things like projecting how a campaign will perform over the remainder of the month based on its early trajectory, flagging that budget is pacing toward overspend before it happens, identifying that a particular audience segment is showing early signals of declining engagement before it shows up in conversion data, or predicting seasonal demand patterns far enough in advance to act on them proactively. The shift from descriptive to predictive changes the time horizon of marketing decisions — from responding to what already happened to shaping what happens next.
How much time can an AI marketing dashboard realistically save?
The most commonly cited estimate from industry research is ten or more hours per week for marketing teams that make the switch from manual reporting to AI-powered dashboards. That time savings comes from eliminating manual data pulls and CSV exports, removing the reconciliation work required when different platforms report different numbers, replacing manual report writing with automatically generated narratives, and shifting from scheduled reviews to real-time alerts so the team only engages with data when something requires attention. The more significant benefit beyond time savings is accuracy — decisions made on automatically normalized, consistently updated data produce better outcomes than decisions made on stale or inconsistently defined numbers.
What should I look for when evaluating AI marketing dashboard tools?
The most important factors are data connectivity, normalization quality, and the intelligence layer. On connectivity: does the platform connect natively to all the channels you actually use without requiring manual exports or third-party connectors? On normalization: does it handle the definitional differences between platforms automatically, or does it still require manual reconciliation? On intelligence: does it go beyond visualization to include anomaly detection, predictive analytics, and actionable recommendations — or is it essentially a prettier version of what you already have? Beyond those core capabilities, consider how accessible the insights are to non-technical users, how current the data is, and whether the platform surfaces insights proactively or still requires you to go looking for them.
How does Ritner Digital help businesses upgrade their marketing analytics?
We audit your current reporting setup — what you're tracking, where the data lives, what's being missed, and how much time your team is spending on reporting versus decision-making. From there we design the marketing intelligence architecture that makes sense for your business: connecting your data sources, setting up the right attribution model, configuring anomaly detection and alerting, and building the dashboards that surface the metrics that actually drive your decisions. The goal is to get your team out of spreadsheets and into a system that tells them what's happening, why it's happening, and what to do about it — without requiring a data analyst for every question.
Build a marketing intelligence system that works for you at ritnerdigital.com/#contact